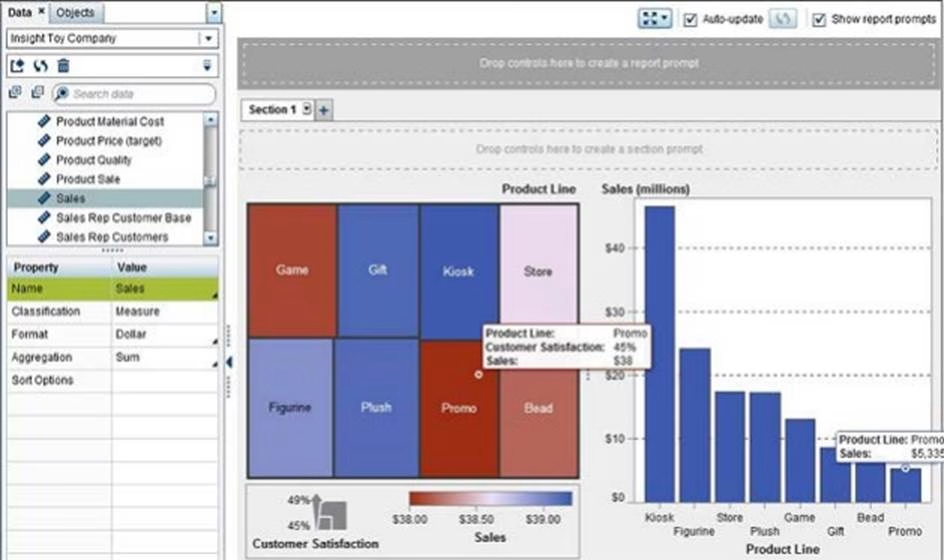
Why is the value for Sales lower in the treemap than in the bar chart?
Refer to the exhibit below from SAS Visual Analytics Designer.

Why is the value for Sales lower in the treemap than in the bar chart?
A . The aggregation for Sales was changed in the treemap.
B . A rank was established on the treemap to only show the top eight values.
C . A data source filter was applied to the treemap.
D . The measure in the treemap is Sales and the measure in the bar chart is Sales (millions).
Answer: A
Latest A00-470 Dumps Valid Version with 130 Q&As
Latest And Valid Q&A | Instant Download | Once Fail, Full Refund
Subscribe
Login
0 Comments
Inline Feedbacks
View all comments

