Which of the following types of charts should be considered to BEST display the data?
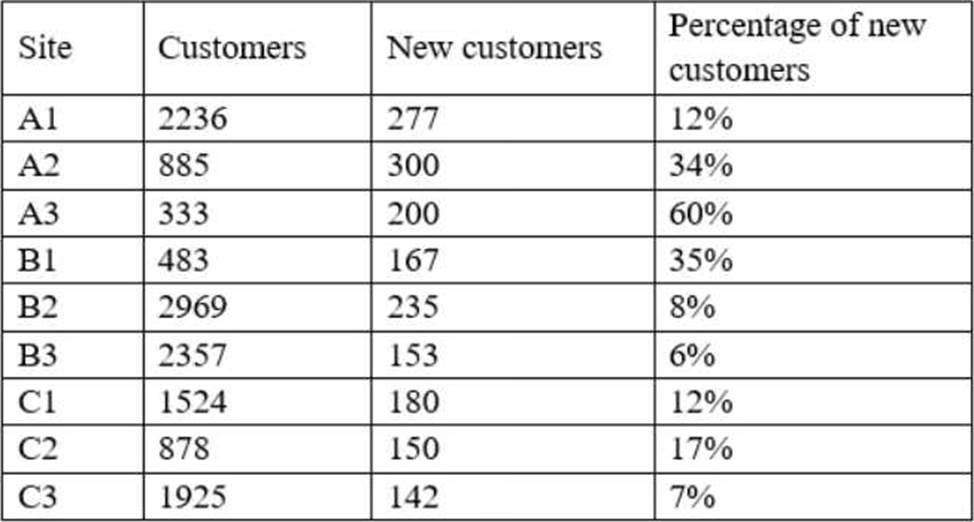
An analyst is designing a dashboard to determine which site has the highest percentage of new customers. The analyst must choose an appropriate chart to include in the dashboard.
The following data is available:

Which of the following types of charts should be considered to BEST display the data?
A . Include a bar chart using the site and the percentage of new customers data.
B . Include a line chart using the site and the percentage of new customers data.
C . Include a pie chat using the site and percentage of new customers data.
D . Include a scatter chart using the site and the percent of new customers data.
Answer: A
Explanation:
This is because a bar chart is a type of chart that shows the value or the amount of a single variable for different categories or groups, such as the percentage of new customers for different sites in this case. A bar chart can be used to display and analyze the comparison, ranking, or proportion among the categories or groups, as well as identify any differences, similarities, or outliers in the data. For example, a bar chart can show which site has the highest or lowest percentage of new customers, as well as show how much each site contributes to the total percentage of new customers. The other types of charts are not the best charts to display the data.
Here is why:
A line chart is a type of chart that shows the change or the trend of a single variable over time, such as the percentage of new customers over months or years in this case. A line chart can be used to display and analyze the movement, cycle, or pattern of the variable, as well as identify any peaks, valleys, or fluctuations in the data. For example, a line chart can show how the percentage of new customers increases or decreases over time, as well as show if there are any seasonal or periodic variations in the data.
A pie chart is a type of chart that shows the proportion or the percentage of a single variable for different categories or groups, such as the percentage of new customers for different sites in this case. A pie chart can be used to display and analyze the composition, distribution, or share of the variable, as well as identify any segments, slices, or fractions in the data. For example, a pie chart can show how much each site represents of the total percentage of new customers, as well as show if there are any dominant or minor sites in the data.
A scatter chart is a type of chart that shows the relationship between two variables for each observation or unit in a data set, such as the percentage of new customers and another variable for each site in this case. A scatter chart can be used to display and analyze the correlation, trend, or pattern among the variables, as well as identify any outliers or clusters in the data. For example, a scatter chart can show if there is a positive, negative, or no correlation between the percentage of new customers and another variable, such as sales revenue or customer satisfaction.
Latest DA0-001 Dumps Valid Version with 180 Q&As
Latest And Valid Q&A | Instant Download | Once Fail, Full Refund

