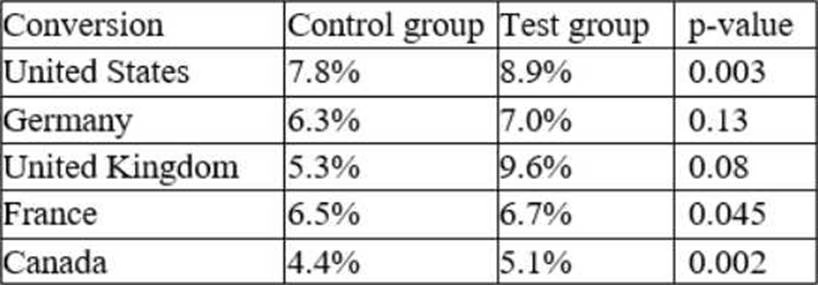
Which of the following conclusions is accurate at a 95% confidence interval?
An e-commerce company recently tested a new website layout. The website was tested by a test group of customers, and an old website was presented to a control group.
The table below shows the percentage of users in each group who made purchases on the websites:

Which of the following conclusions is accurate at a 95% confidence interval?
A . In Germany, the increase in conversion from the new layout was not significant.
B . In France, the increase in conversion from the new layout was not significant.
C . In general, users who visit the new website are more likely to make a purchase.
D . The new layout has the lowest conversion rates in the United Kingdom.
Answer: A
Explanation:
The p-value is a measure of how likely it is to observe a difference in conversion rates as large or larger than the one observed, assuming that there is no difference between the groups. A common threshold for statistical significance is 0.05, meaning that there is a 5% or less chance of observing such a difference by chance alone. The table shows the p-values for each country, and we can see that only Germany has a p-value above 0.05 (0.13). This means that we cannot reject the null hypothesis that there is no difference in conversion rates between the test and control groups in Germany. Therefore, the increase in conversion from the new layout was not significant in Germany. For the other countries, the p-values are below 0.05, indicating that the increase in conversion from the new layout was statistically significant. Option A is correct.
Option B is incorrect because the increase in conversion from the new layout was significant in France (p-value = 0.002).
Option C is incorrect because it does not account for the variation across countries. While the overall conversion rate for the test group (8.4%) is higher than the control group (6.8%), this difference may not be statistically significant when we consider the country-specific effects.
Option D is incorrect because the new layout has the highest conversion rate in the United Kingdom
(9.6%), not the lowest.
Reference:
P-value Calculator & Statistical Significance Calculator
p-value Calculator | Formula | Interpretation
How to obtain the P value from a confidence interval | The BMJ Confidence Intervals & P-values for Percent Change / Relative Difference
Latest DA0-001 Dumps Valid Version with 180 Q&As
Latest And Valid Q&A | Instant Download | Once Fail, Full Refund

