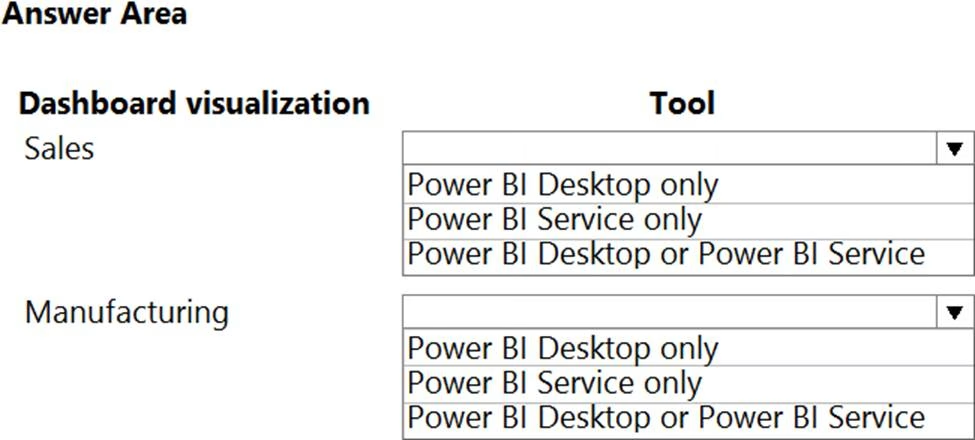
What should you use to create the visualizations?
HOTSPOT
You need to create the solution assets.
What should you use to create the visualizations? To answer, select the appropriate options in the answer area. NOTE: Each correct selection is worth one point.

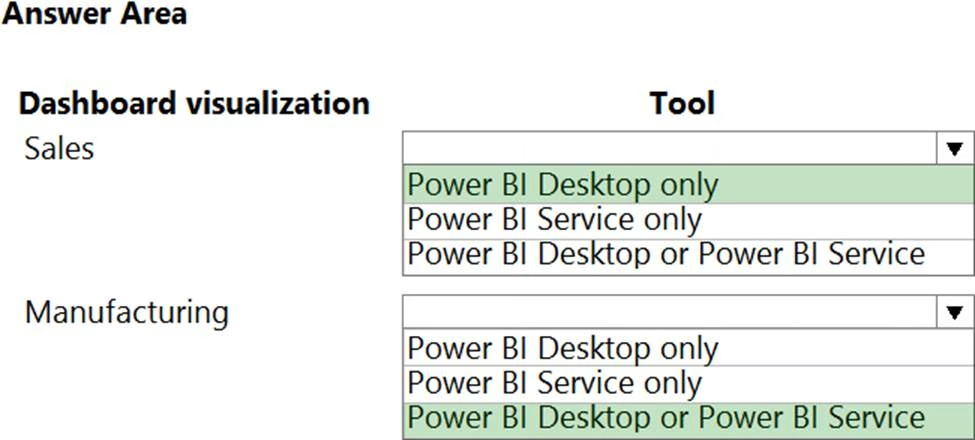
Answer: 
Explanation:
Box 1: PowerBI Desktop
The Sales dashboard must reside in the Sales channel and must include information about active quotes, sales pipeline, and year-to-date sales KPIs for sales quotas by region.
PowerBI Desktop to support many data source.
Box 2: PowerBI Desktop or Power BI Service on
A dashboard that shows a capacity Heat map by month as well as expected sales that are likely to close for the next month.
Both support visualizations.
Reference: https://docs.microsoft.com/en-us/power-bi/fundamentals/service-service-vs-desktop
Latest PL-100 Dumps Valid Version with 86 Q&As
Latest And Valid Q&A | Instant Download | Once Fail, Full Refund

