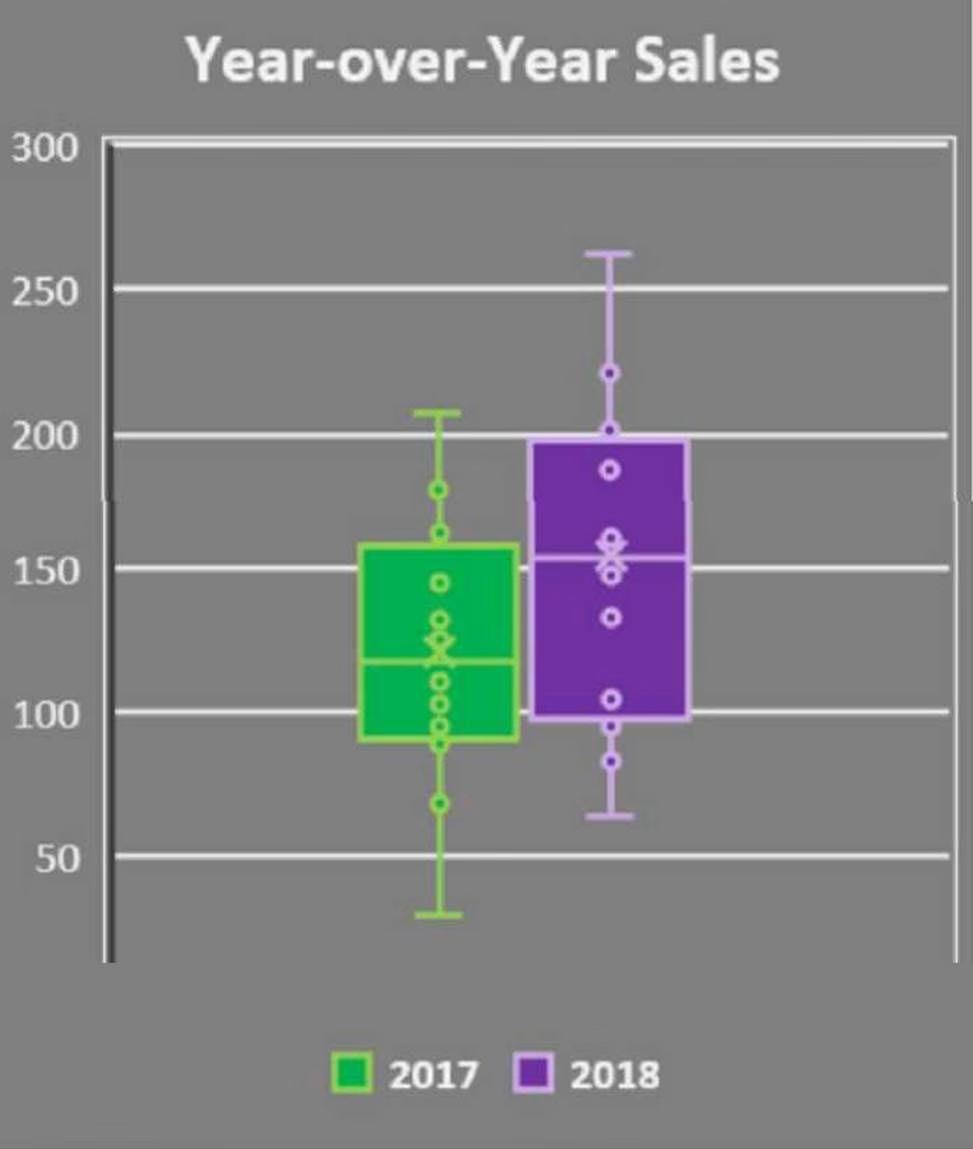
What is the conclusion he can make from this chart?
A software company launched a new product in late 2016. The product manager is reviewing a Box and Whisker plot used to compare year-over-year sales, from 2017 to 2018.

What is the conclusion he can make from this chart?
A . 2017 minimum and maximum sales are higher than 2018, and the 2017 median result is higher than the 2018 median result
B . 2017 minimum and maximum sales are higher than 2018, but the 2017 median result is lower than 2018 1st quartile result
C . 2018 minimum and maximum sales are higher than 2017, and the 2018 quartile results are higher than 2017 quartile results
D . 2018 minimum and maximum sales are higher than 2017, and the 2018 1st quartile is higher than 2017 median result
Answer: D
Latest CBDA Dumps Valid Version with 152 Q&As
Latest And Valid Q&A | Instant Download | Once Fail, Full Refund

