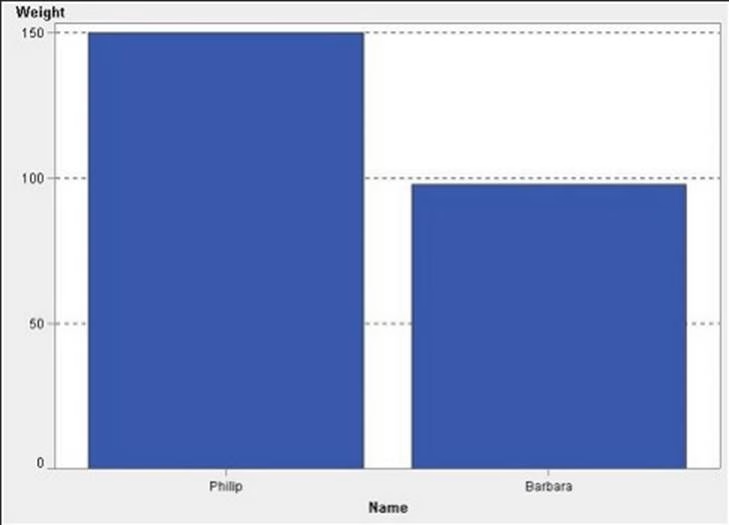
What happens to the graph above if the content developer creates a Display Rule to set the graph to red if "Age > 14"?
Refer to the bar chart from SAS Visual Analytics Designer.

Philip is 16 years old. Barbara is 13 years old.
What happens to the graph above if the content developer creates a Display Rule to set the graph to red if "Age > 14"?
A . The Philip bar would turn red.
B . None of the bars change.
C . On the graph only the Philip bar displays.
D . Age replaces the Weight measure.
Answer: A
Latest A00-470 Dumps Valid Version with 130 Q&As
Latest And Valid Q&A | Instant Download | Once Fail, Full Refund
Subscribe
Login
0 Comments
Inline Feedbacks
View all comments

