VMware 2VB-602 VMware Specialist: vRealize Operations 2017 Exam Online Training
VMware 2VB-602 Online Training
The questions for 2VB-602 were last updated at Apr 22,2025.
- Exam Code: 2VB-602
- Exam Name: VMware Specialist: vRealize Operations 2017 Exam
- Certification Provider: VMware
- Latest update: Apr 22,2025
Endpoint Operations agent plug-ins for application monitoring (such as MS SQL, IIS, Apache) are included with which vRealize Operations licensing? (Choose the best answer.)
- A . vRealize Operations Enterprise
- B . vRealize Operations Standard
- C . vSphere with Operations Manager
- D . vRealize Operations Advanced
What is the length of the sliding window used to calculate recommended capacity? (Choose the best answer.)
- A . 60 days
- B . 90 days
- C . 120 days
- D . 30 days
Endpoint Operations provides the native ability to monitor supported operating systems and applications within vRealize Operations.
What are additional capabilities of Endpoint Operations? (Choose the best answer.)
- A . Script monitors, hardware monitors and anti-virus
- B . Process monitors, script monitors and patch monitors
- C . Security monitors, hardware monitors and patch monitors
- D . Remote monitors, process monitors and script monitors
After running the Rebalance Container action, where can a user view the status and verify all of the virtual machines were moved? (Choose the best answer.)
- A . Recent Tasks
- B . Home Screen
- C . Alerts tab
- D . Workload Utilization dashboard
What is required for configuring the autoswitch of dashboards? (Choose the best answer.)
- A . Enabling all dashboards for auto transition, which will then transition all every five minutes, in the order dashboards were first opened
- B . No action; dashboards will automatically switch through all open tabs, with one transition every five minutes
- C . Enabling specific dashboards for auto transition, selecting the switch time interval from one dashboard to the next, and determining the transition order of the enabled dashboards
- D . Deleting dashboards from the autoswitch configuration that should NOT be in the transitions, selecting the switch time interval from one dashboard to the next, and determining the transition order of the remaining dashboards
Which items may be contained in a management pack for vRealize Operations? (Choose the best answer.)
- A . Sample configurations, logs and authentication sources
- B . Queries, reports and content packs
- C . Adapter, reports, dashboards, symptoms and alerts
- D . Adapter, resources, logs and views
Which view type would display a tabular data set of specific objects in a monitored environment? (Choose the best answer.)
- A . List
- B . Distribution
- C . Text
- D . Trend
Which is a true statement about creating new Alert Definitions? (Choose the best answer.)
- A . All Alert Definitions exist only in the alert policy
- B . Alert Definitions cannot be enabled or disabled in policies
- C . When creating new Alert Definitions, they are enabled by default in the default policies
- D . After creating a new Alert Definition, it must be enabled in policies
Which statement is true about alert ownership? (Choose the best answer.)
- A . A user can assign ownership of an alert to any other user
- B . A user can take ownership of an alert
- C . A user can only assign ownership of an alert to a user within the same group
- D . Ownership is automatically assigned based on the alert definition
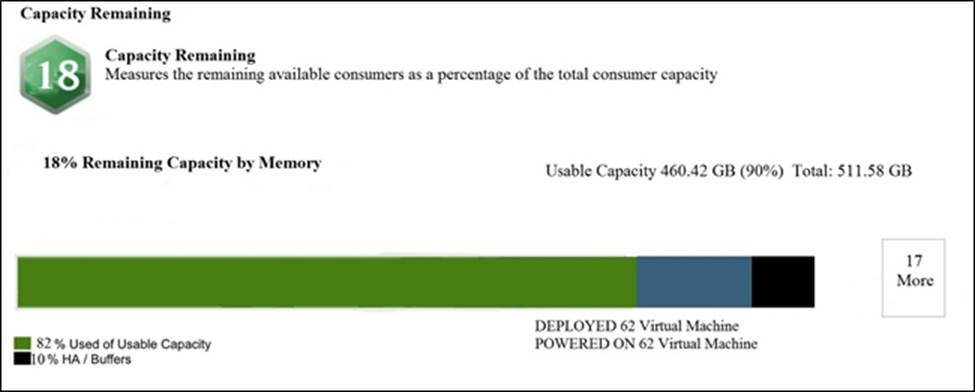
View the Exhibit

What does the referenced Capacity Remaining widget, when included in a dashboard, display? (Choose the best answer.)
- A . The selected object’s general capacity remaining score and a bar chart of the object’s resource with the least remaining capacity
- B . The selected object resources’ capacity remaining scores represented as bar segments for remaining CPU, memory and disk space
- C . The selected object’s worst resource capacity remaining score and bar segments that list all of the object’s resources enabled by policy for capacity remaining calculation
- D . The selected object’s capacity remaining score and a bar chart showing numbers of subscribers, such as virtual machines on a cluster
Latest 2VB-602 Dumps Valid Version with 116 Q&As
Latest And Valid Q&A | Instant Download | Once Fail, Full Refund

