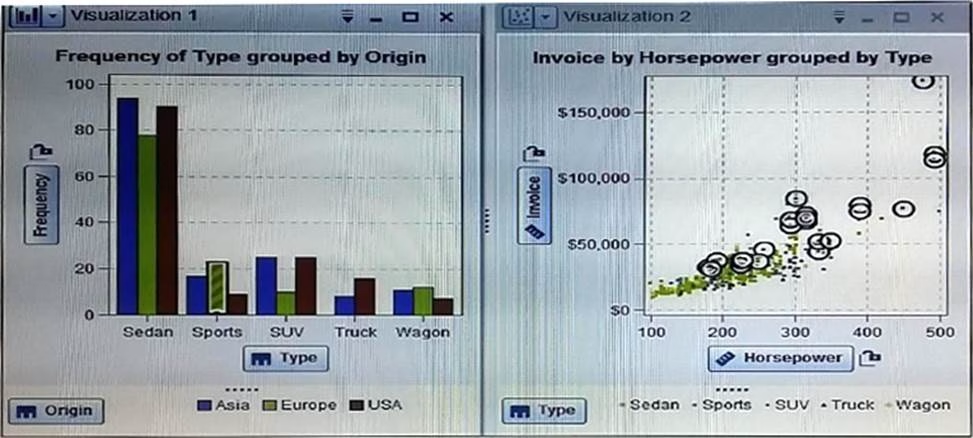
There are two visualizations given in the area:
There are two visualizations given in the area:

When a bar is selected in the bar chart, the markers in the scatter plot that correspond to the selected value in the bar area are highlighted.
This feature used in SAS Visual Analytics Explorer called:
A . Report level display rules
B . Data Brushing
C . Conditional Highlighting
D . File interaction
Answer: B
Latest A00-470 Dumps Valid Version with 130 Q&As
Latest And Valid Q&A | Instant Download | Once Fail, Full Refund
Subscribe
Login
0 Comments
Inline Feedbacks
View all comments

