For this question, please refer to the following control chart, which shows the results of the last 23 runs of a process. The process has been in operation for 500 runs, and each run takes 1 day.
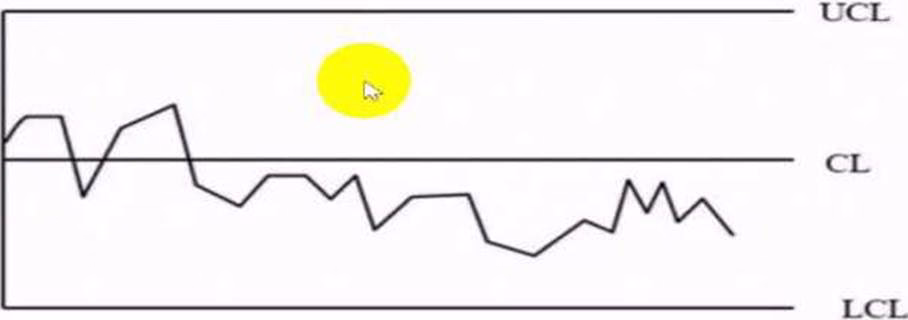
The control chart shows which of the following?
A . A process shift
B . A process instability
C . Normal variation
D . A cyclical trend
Answer: A
Latest CMQ-OE Dumps Valid Version with 348 Q&As
Latest And Valid Q&A | Instant Download | Once Fail, Full Refund
