Tableau TDS-C01 Tableau Desktop Specialist Online Training
Tableau TDS-C01 Online Training
The questions for TDS-C01 were last updated at Mar 03,2026.
- Exam Code: TDS-C01
- Exam Name: Tableau Desktop Specialist
- Certification Provider: Tableau
- Latest update: Mar 03,2026
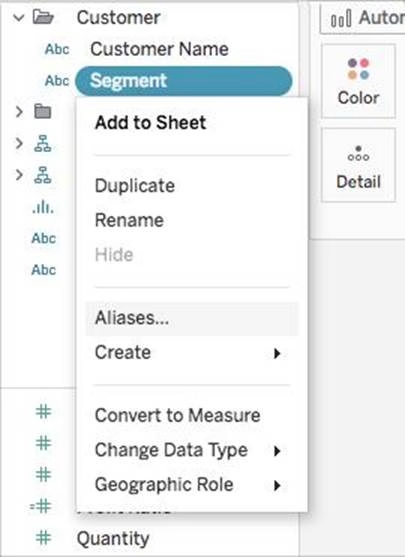
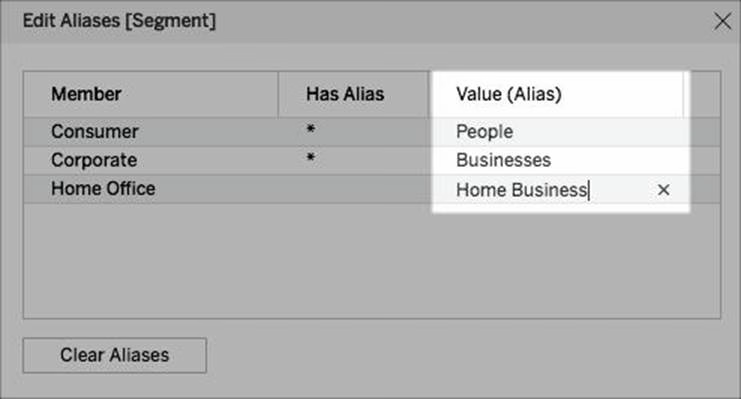
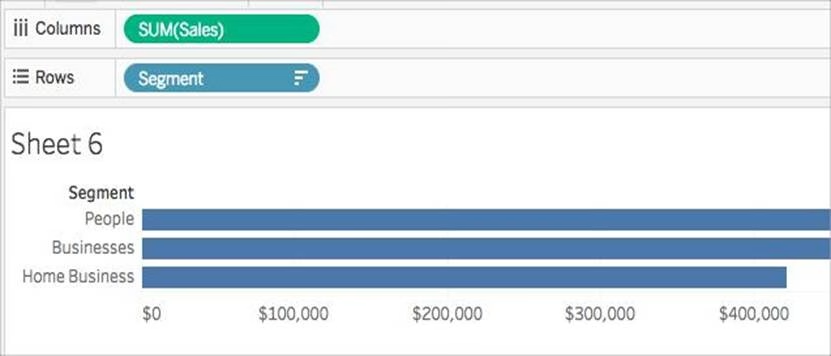
You can create _______________ for members in a dimension so that their labels appear differently in the view.
- A . parameters
- B . duplicates
- C . copies
- D . aliases
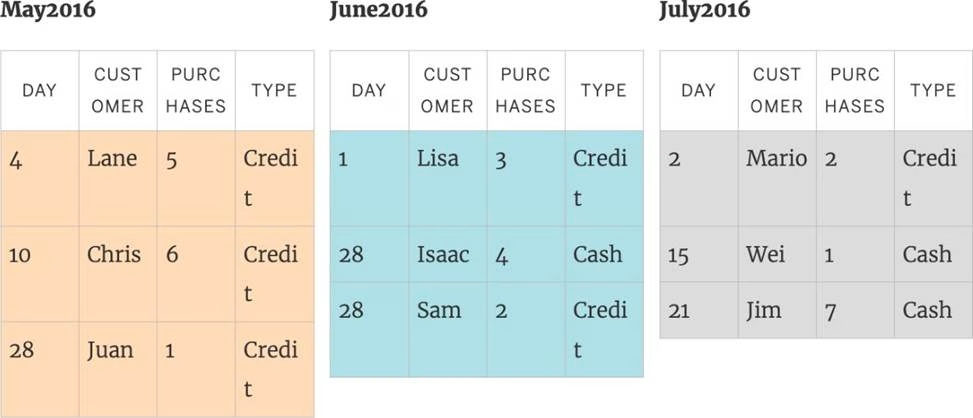
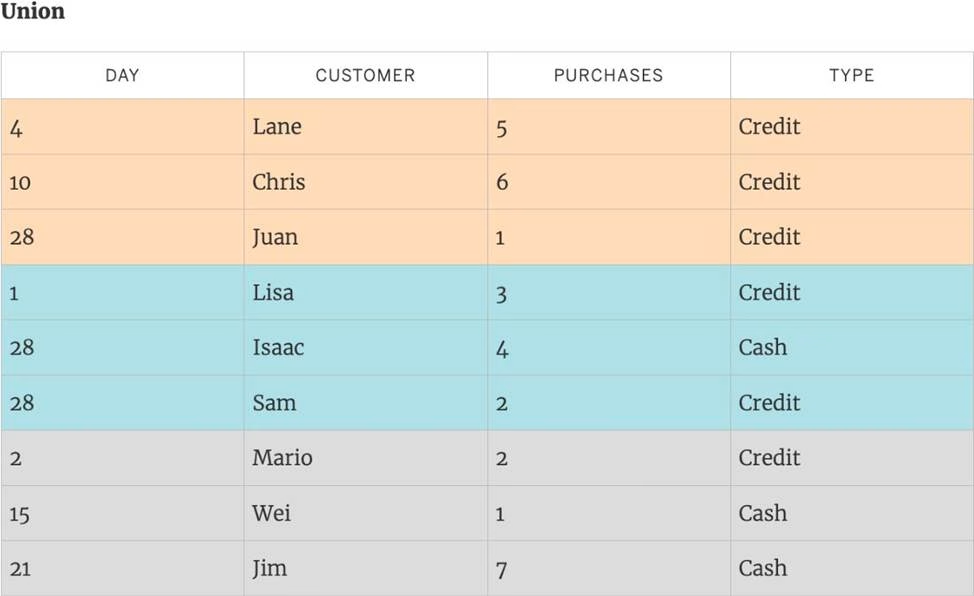
You can _______________ your data to combine two or more tables by appending values (rows)
from one table to another
- A . join
- B . blend
- C . concatenate
- D . union
Larger image
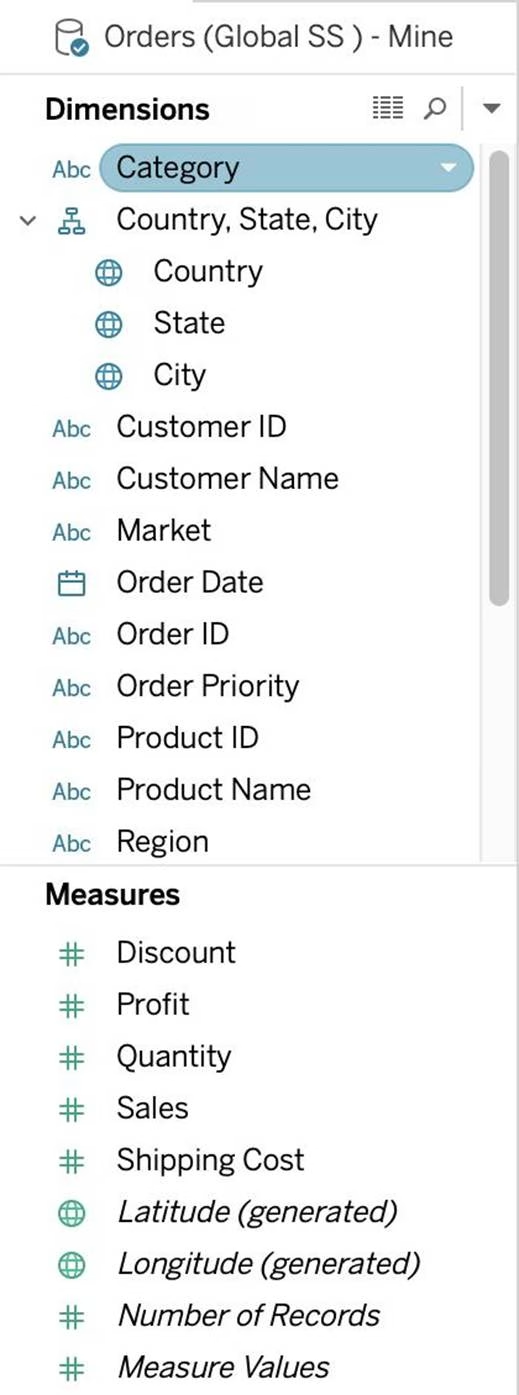
What is this view referred to as in Tableau?
- A . Analytics Pane
- B . Window Pane
- C . Data Pane
- D . Dimensions & Measures
DOWNLOAD THE DATASET FROM: https://drive.google.com/drive/folders/1WXzqsrNmXVdmQ-574wld4InEplyKT8RP?usp=sharing (if you haven’t already)
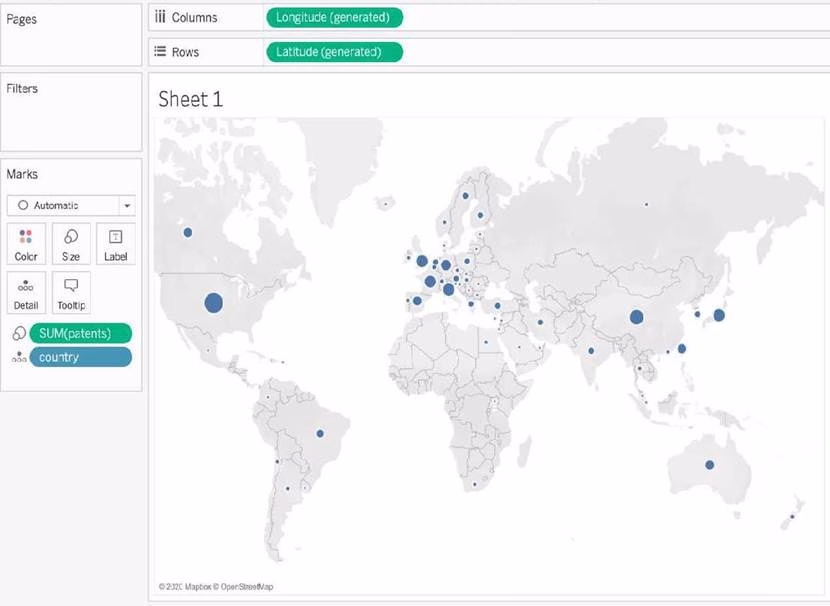
Using the cwurData table, plot a Map to see which country had the Second highest number of patents in the Year 2013?
- A . United States
- B . France
- C . United Kingdom
- D . Canada
DOWNLOAD THE DATASET FROM: https://drive.google.com/drive/folders/1WXzqsrNmXVdmQ-574wld4InEplyKT8RP?usp=sharing (if you haven’t already)
Using the cwurData table, plot a Map to see which country had the Second highest number of patents in the Year 2013?
- A . United States
- B . France
- C . United Kingdom
- D . Canada
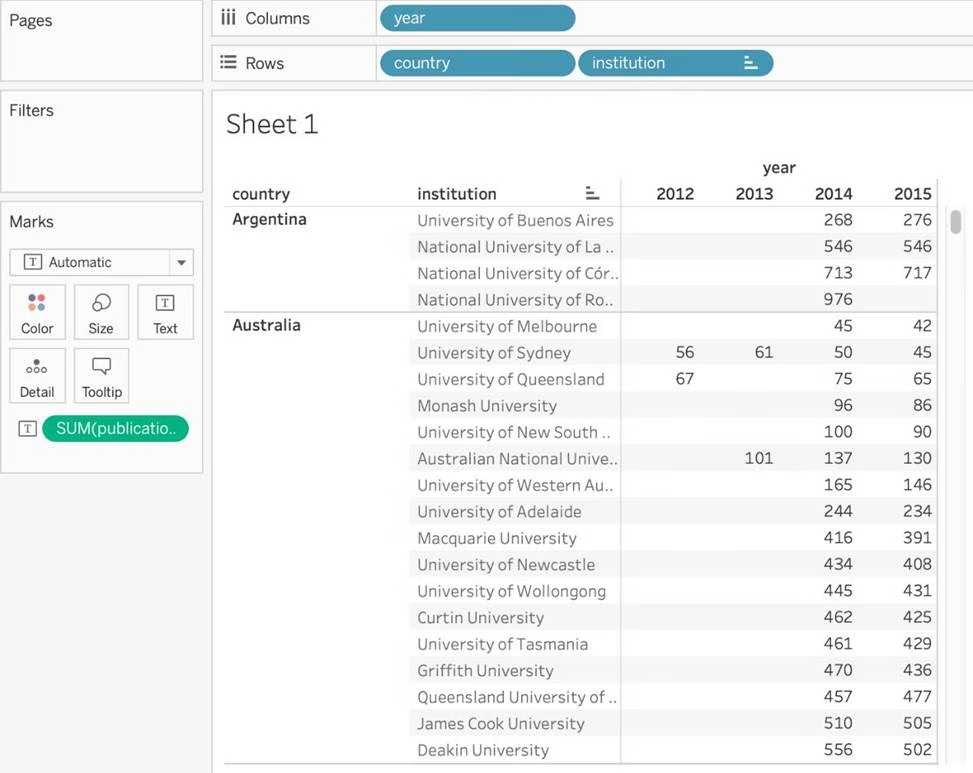
Using the cwurData table, create a cross-tab showing the number of Publications per Country broken down by Institution, and filtered by Country to only show United Kingdown (UK).
For the University of Manchester, what percent of the total publications were contributed in 2014?
- A . 28.415%
- B . 23.497%
- C . 25.683%
- D . 22.404%
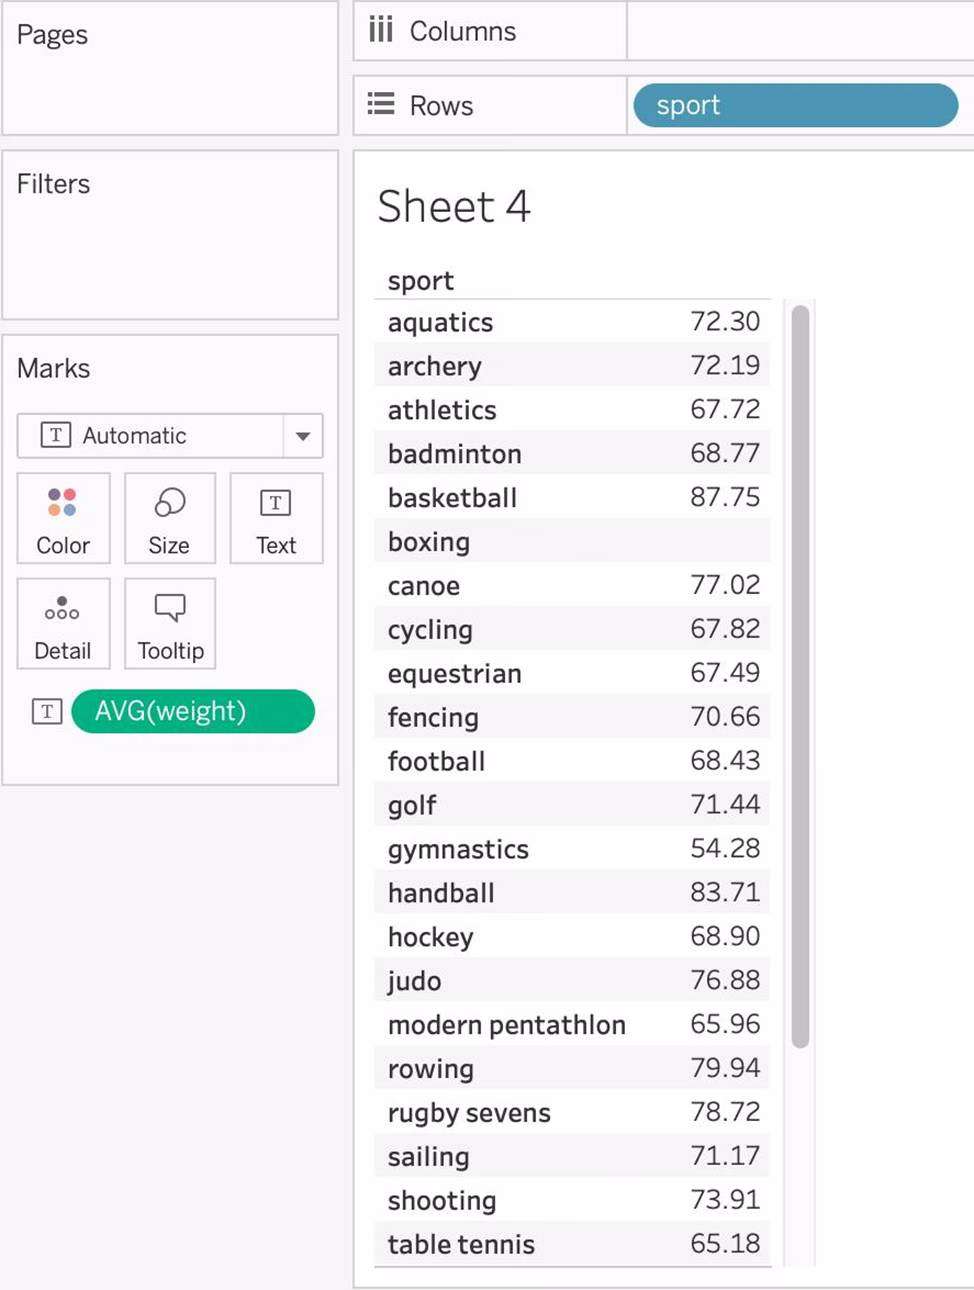
Using the atheletes table:
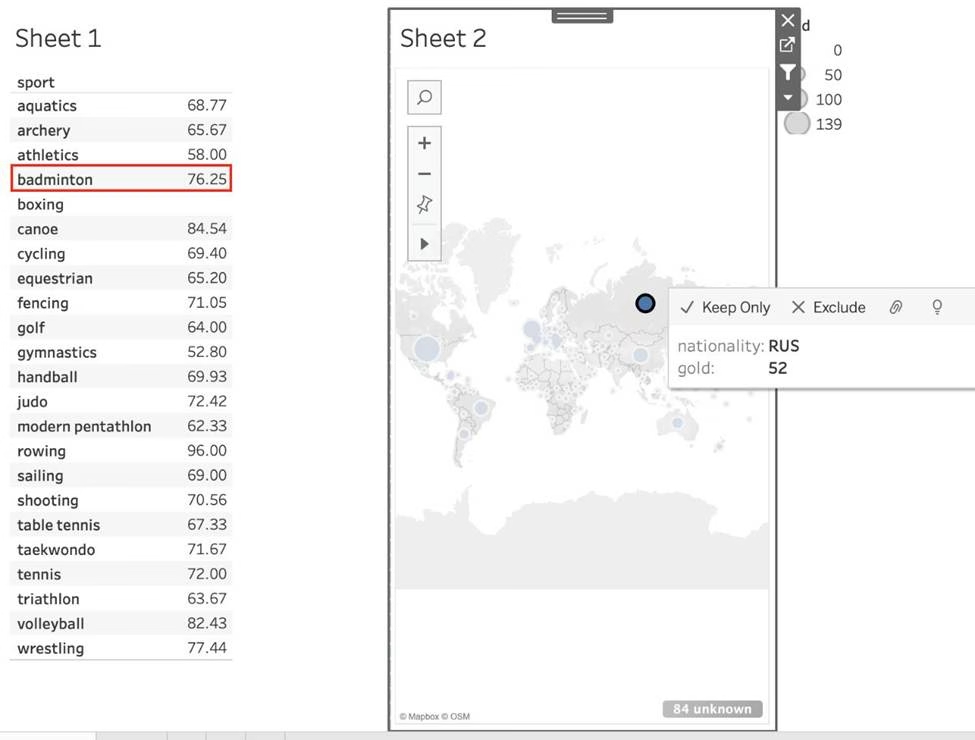
i) Create a sheet with a crosstab showing the Average weight for each sport (Sheet 1)
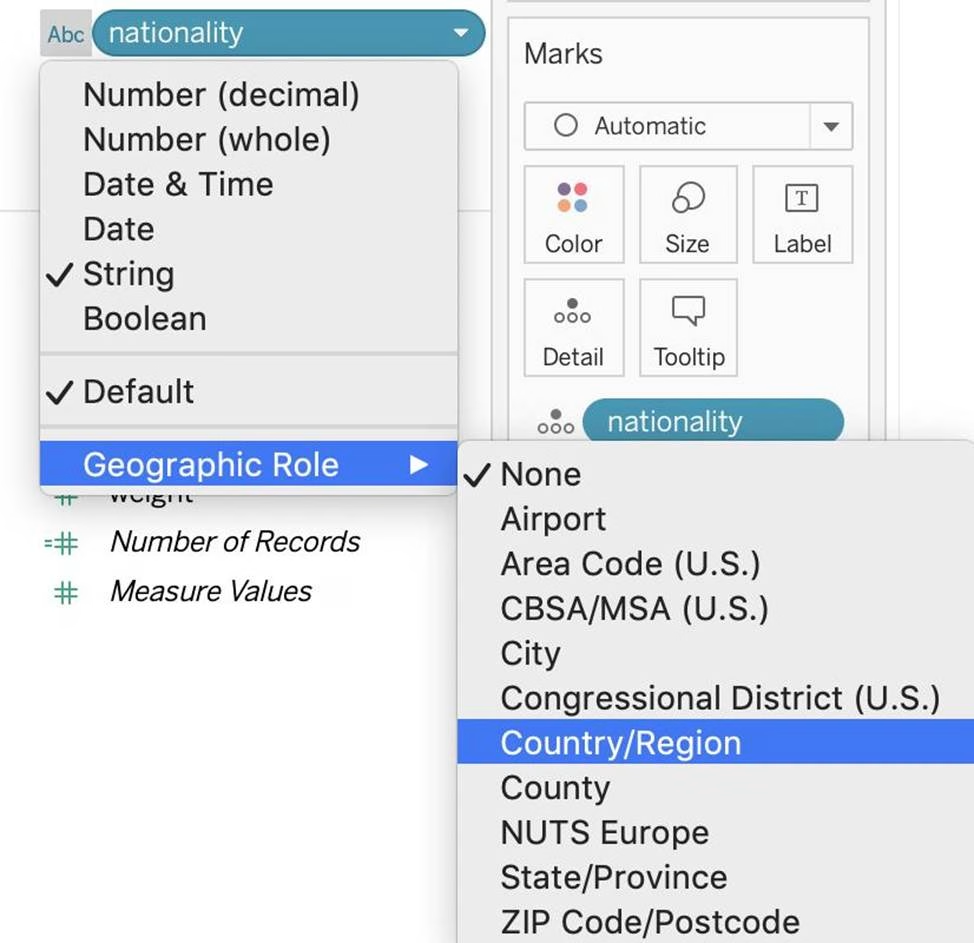
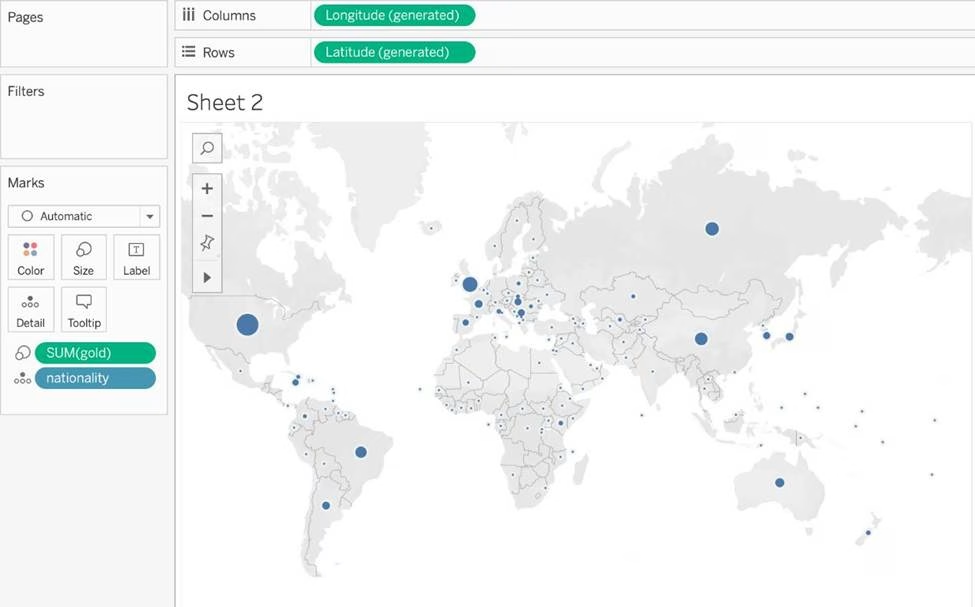
ii) Create a sheet with a Map showing the Total number of gold medals per Country. Use size as a Mark. (Sheet 2)
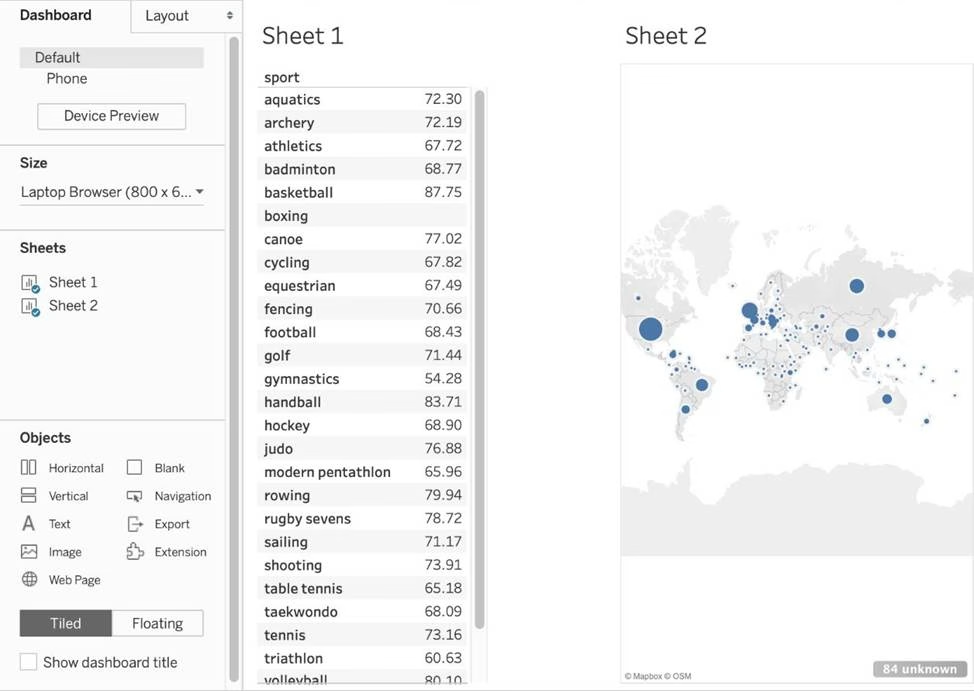
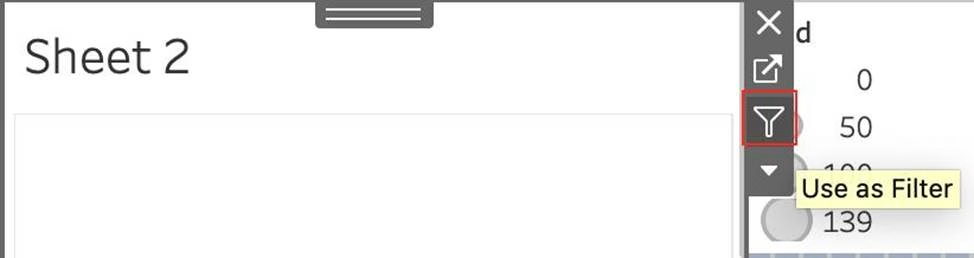
Now, Create a Dashboard containing both these sheets, and Use Sheet 2 as a Filter for Sheet 1.
What was the average weight for Badminton in Russia? (Ignore any nulls / unknowns)
- A . 76.25
- B . 65.67
- C . 68.77
- D . 4.87
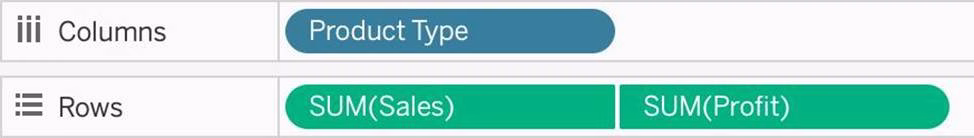
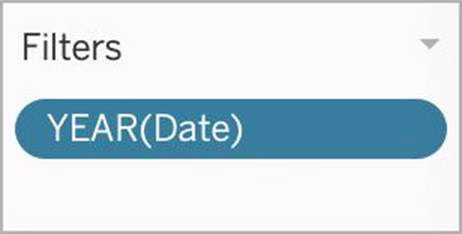
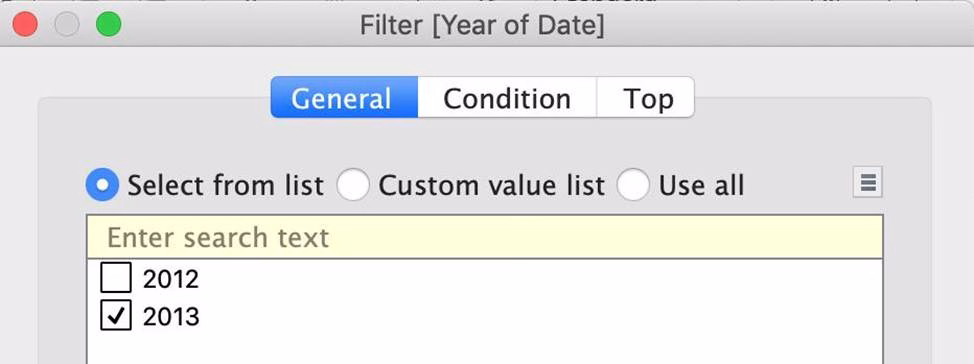
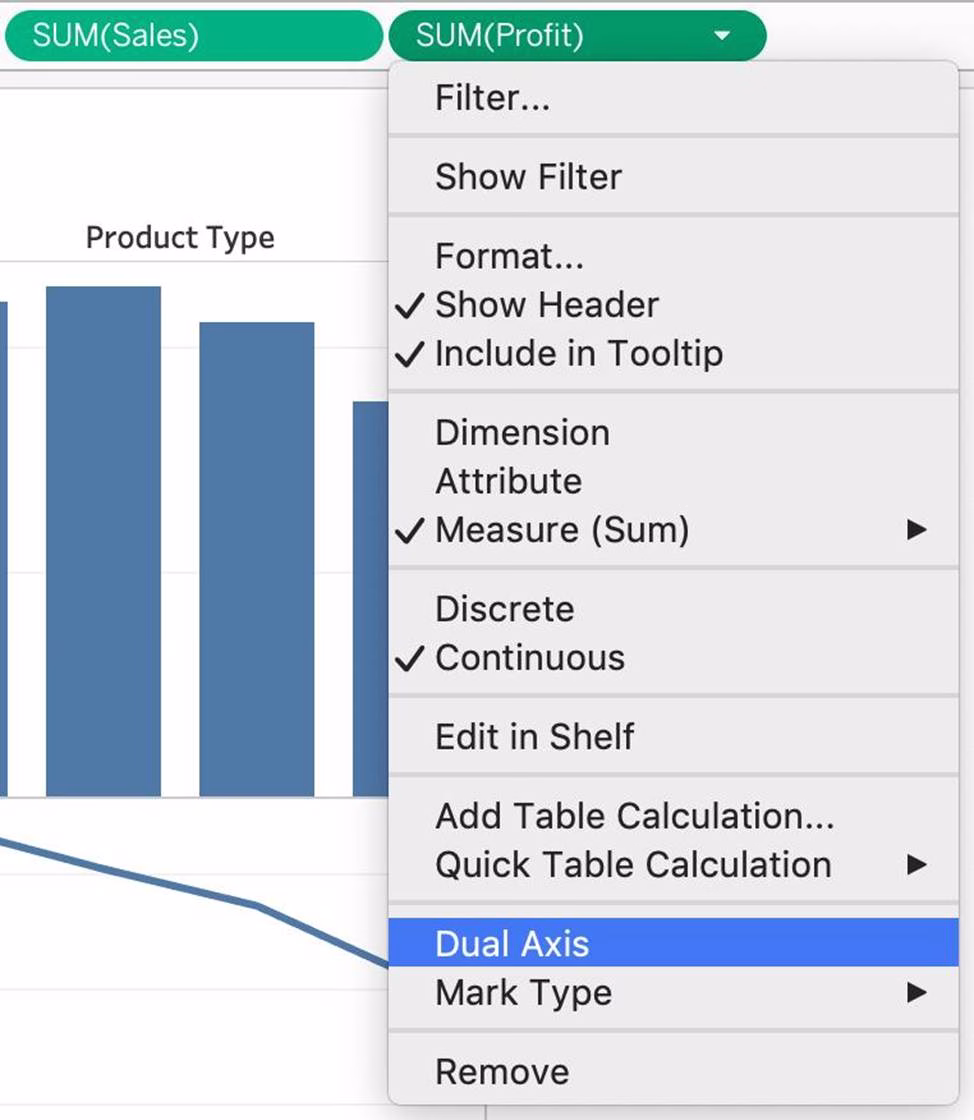
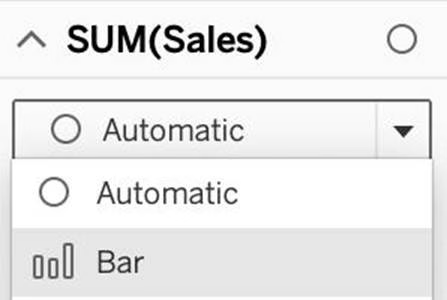
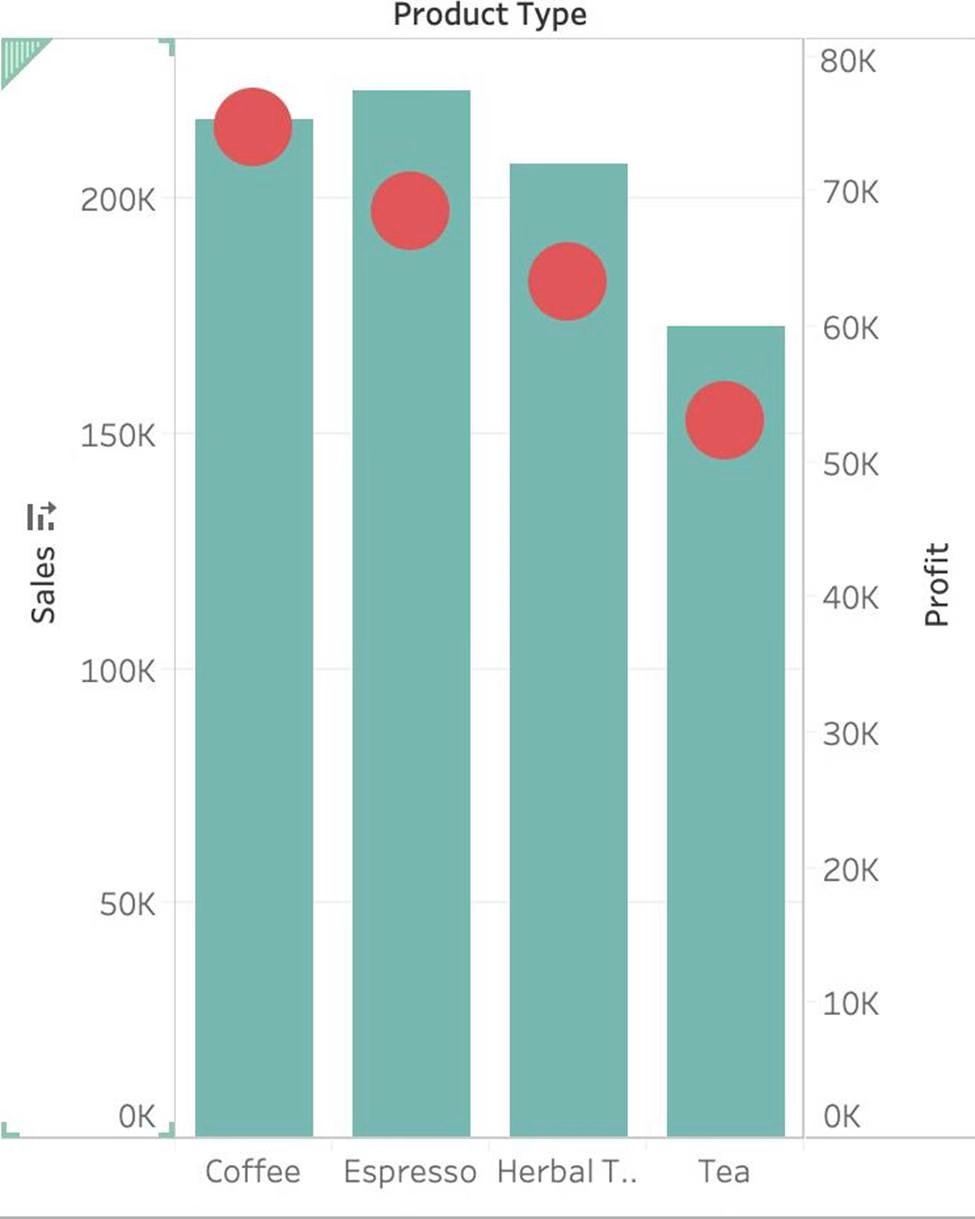
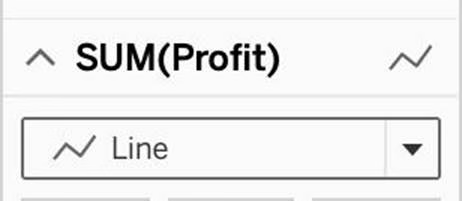
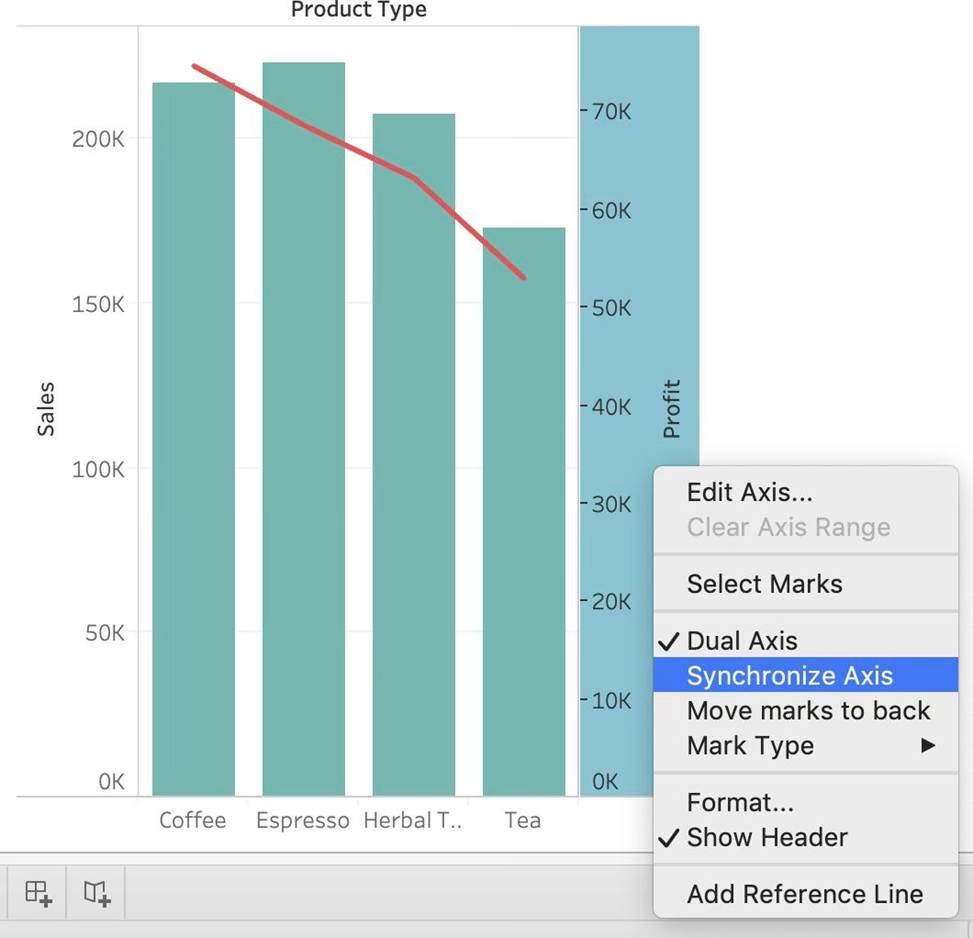
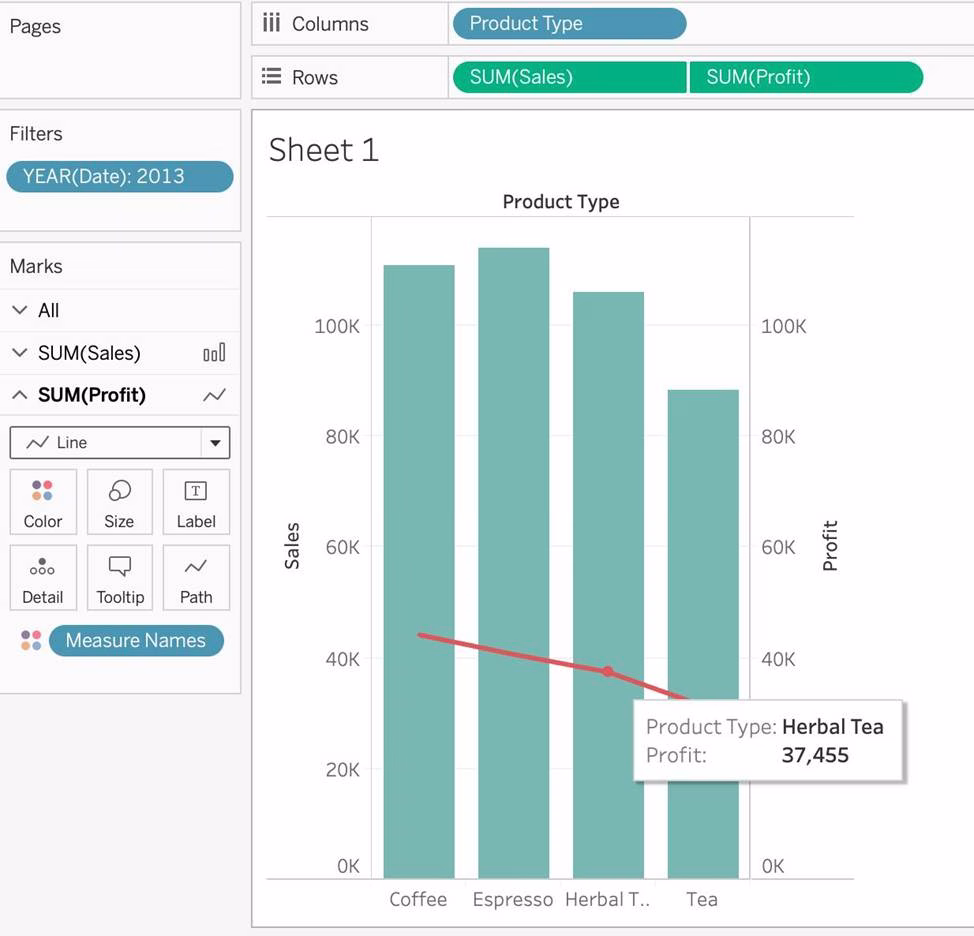
Using the CoffeeChain table, create a Dual Axis chart showing the Sales (Bar chart) and Profit (Line Chart) for each Product type.
What was the Profit for the Herbal Tea product type in 2013?
- A . 68,620
- B . 74,683
- C . 37,455
- D . 46,493
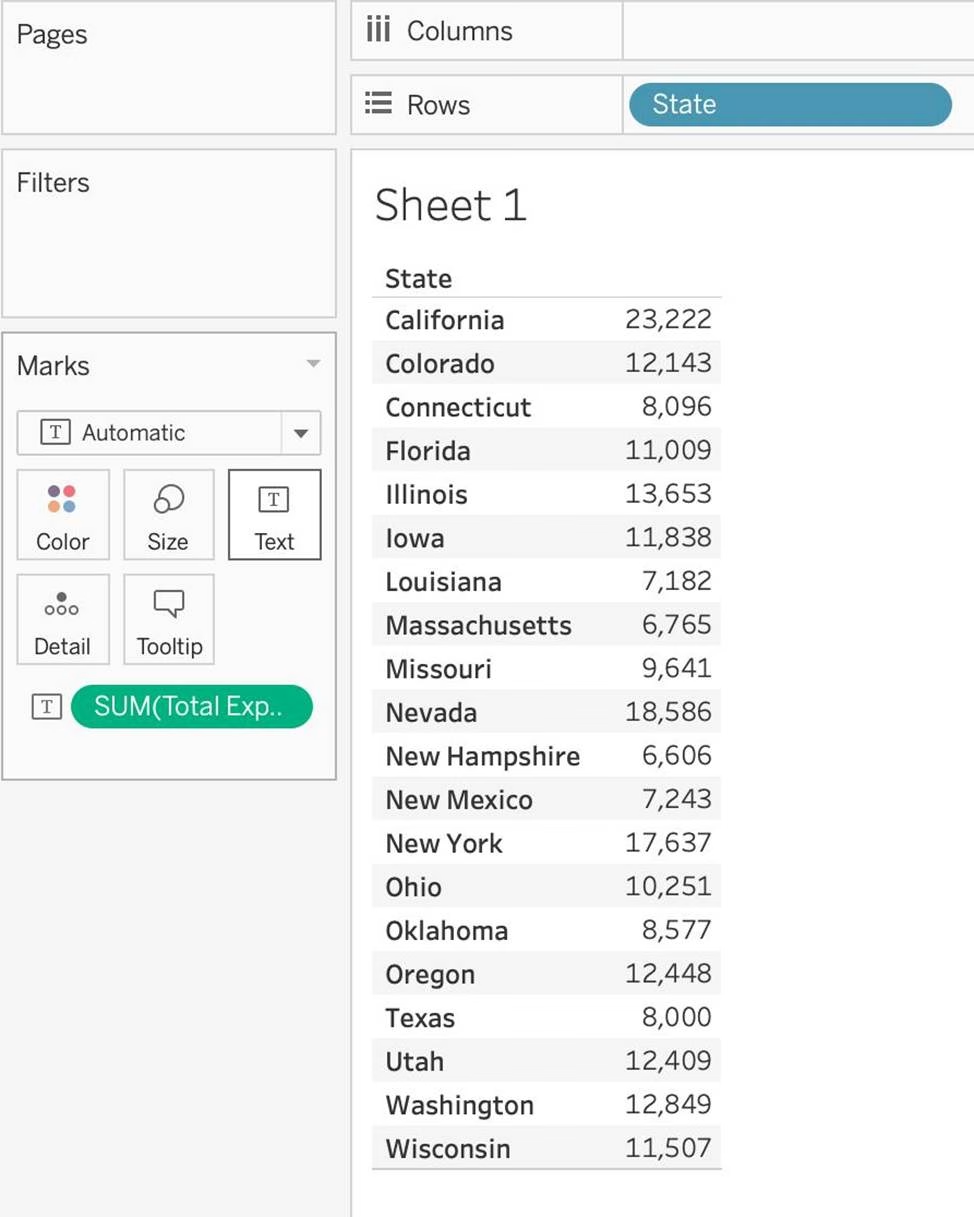
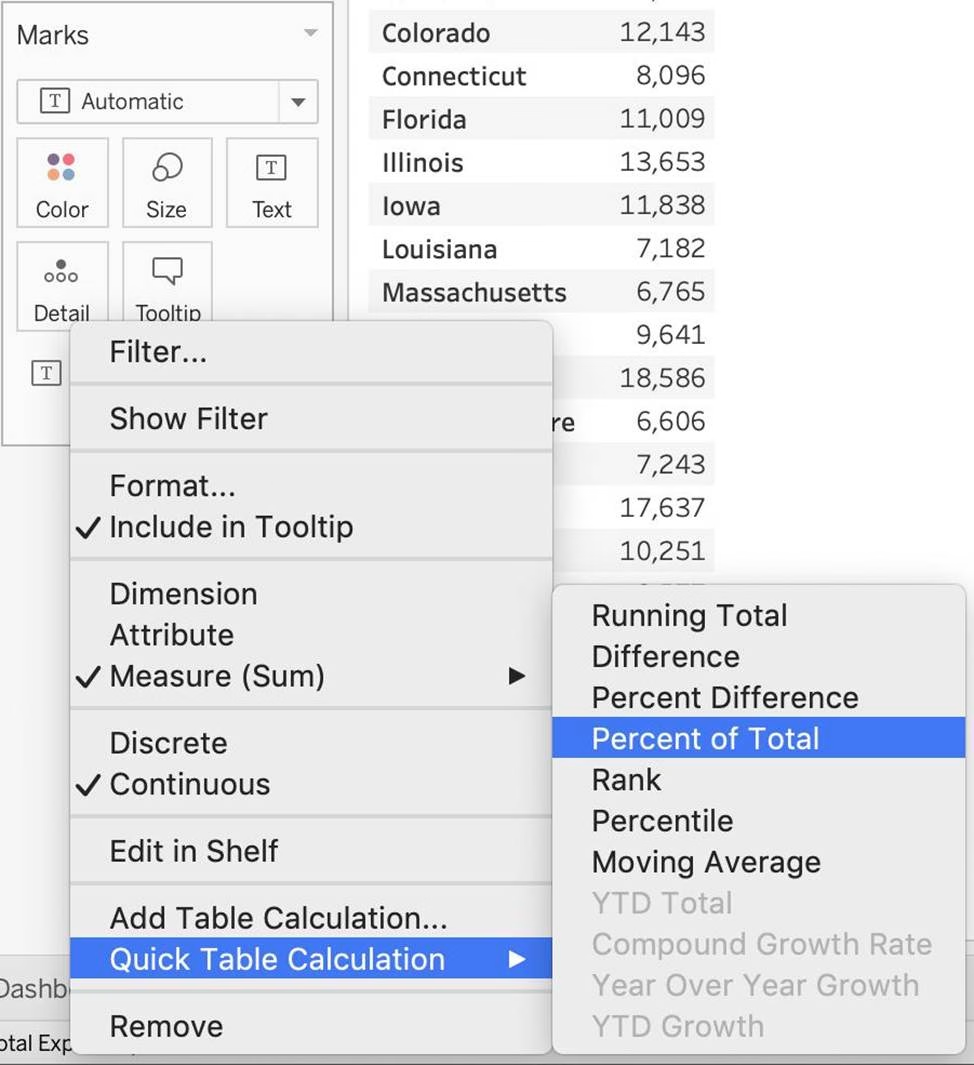
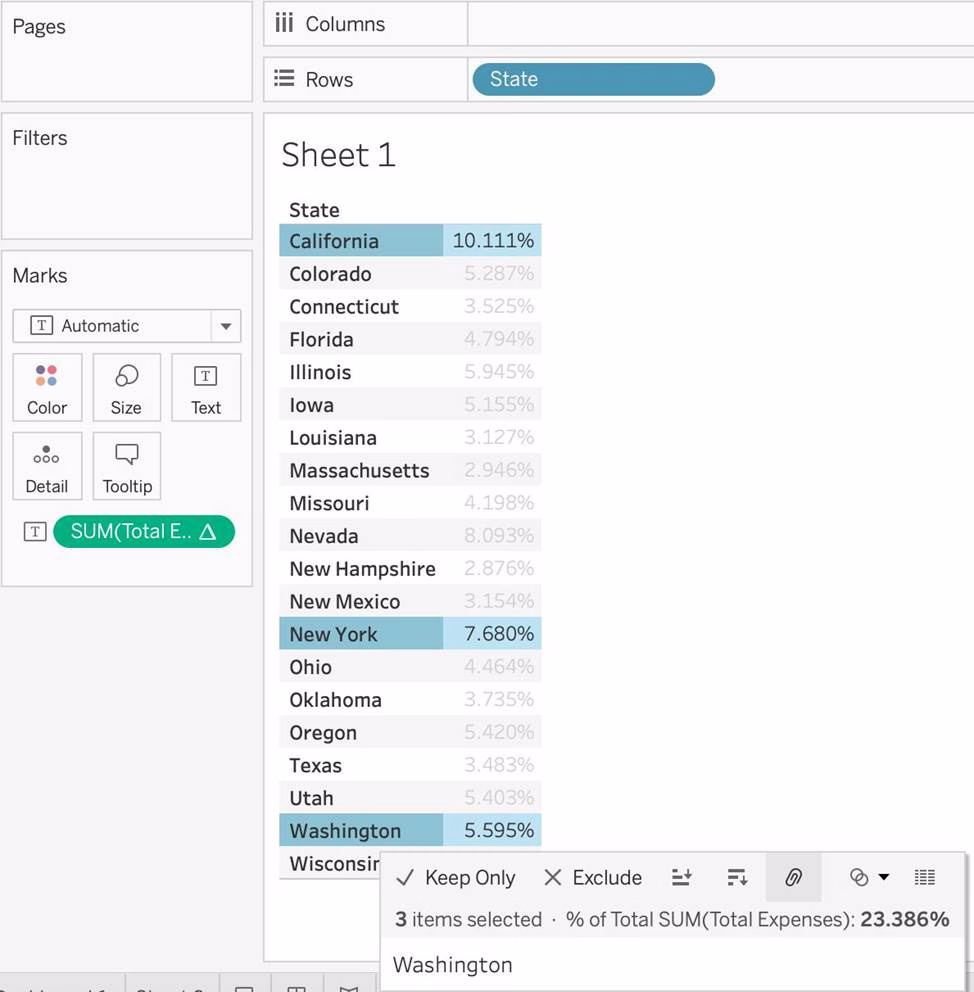
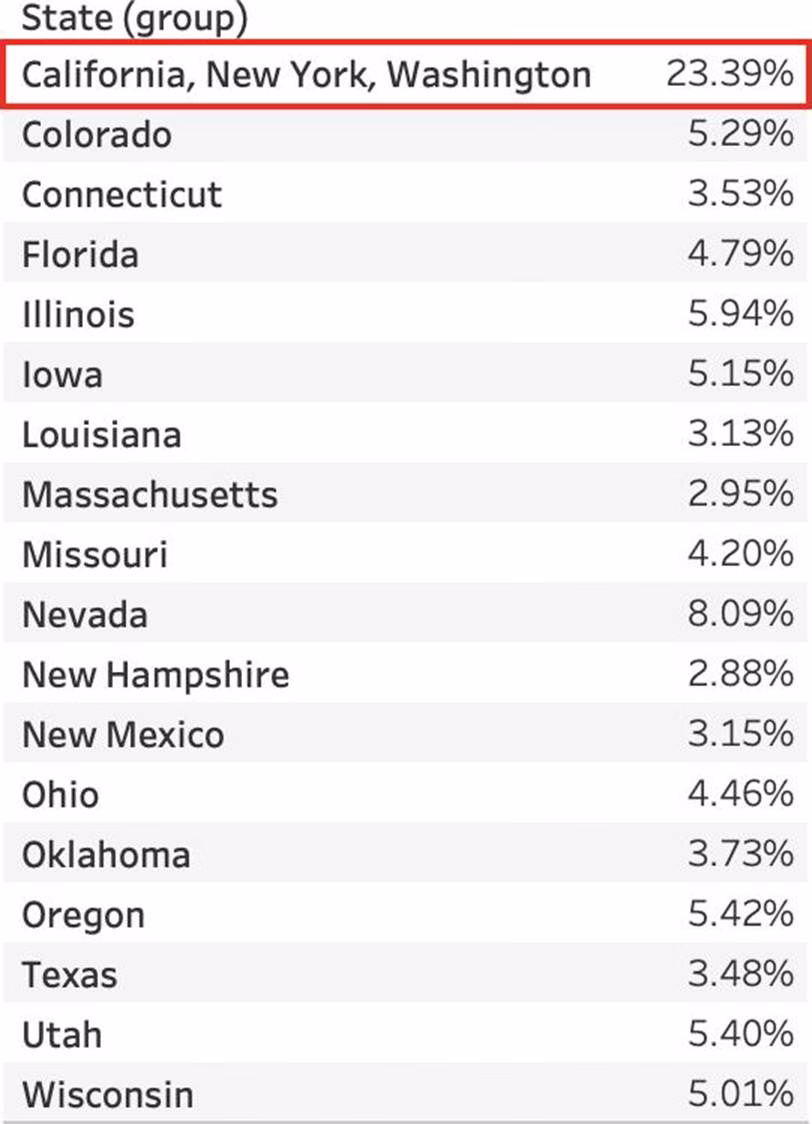
Using the CoffeeChain table, create a crosstab showing the Total Expenses per State and add Column Grand Totals to the view. Now group the states of New York, California and Washington.
What percent of the total sales does this group contribute?
- A . 25.79%
- B . 23.39%
- C . 27.73%
- D . 29.49%
Latest TDS-C01 Dumps Valid Version with 151 Q&As
Latest And Valid Q&A | Instant Download | Once Fail, Full Refund
