Tableau TDS-C01 Tableau Desktop Specialist Online Training
Tableau TDS-C01 Online Training
The questions for TDS-C01 were last updated at Nov 23,2024.
- Exam Code: TDS-C01
- Exam Name: Tableau Desktop Specialist
- Certification Provider: Tableau
- Latest update: Nov 23,2024
Which of the following are valid ways to copy a worksheet visualisation as an image?
- A . By simply clicking Control + V on the keyboard
- B . By clicking on Worksheet in the Tableau Main Menu above, and choosing Copy->Image
- C . Using the Marks shelf and choosing Copy->Image
- D . By right clicking on the worksheet visualisation and selecting Copy->Image
B,D
Explanation:
The following are 2 correct ways to copy the worksheet visualisation as an image:
AND
Reference: https://help.tableau.com/current/pro/desktop/en-us/save_export_image.htm
Which of the following are benefits of combining sheets using dashboards?
- A . Easier to compare visualisations side by side
- B . It is mandatory to combine sheets when using Tableau
- C . Helps in faster analysis
- D . Provides the ability to use one sheet as a filter for other
A,C,D
Explanation:
The only incorrect option is – It is mandatory to combine sheets when using Tableau.
All others are valid advantages that Dashboards provide when using Tableau!
True or False: It is not possible to blend axes for multiple measures into a single axis
- A . False
- B . True
A
Explanation:
We can very much blend multiple measures into a single axis. Such charts are called Combined-Axis / Blended-Axis charts.
Follow along:
Measures can share a single axis so that all the marks are shown in a single pane. To blend multiple measures, drag one measure or axis and drop it onto an existing axis.
Instead of adding rows and columns to the view, when you blend measures there is a single row or column and all of the values for each measure is shown along one continuous axis. For example, the view below shows quarterly sales and profit on a shared axis.
Note: If you drag a measure on to the canvas and only see a single ruler indicator instead of the double ruler indicator shown below, Tableau creates dual axes instead of a blended axis. For more information about how to create dual axes, see Compare two measures using dual axes.
Reference: https://help.tableau.com/current/pro/desktop/en-us/multiple_measures.htm
Which of the following can help us focus on specific data without removing data in the visualization?
- A . Highlighters
- B . Sets
- C . Clusters
- D . Filters
A
Explanation:
From the official documentation:
When you have a view with a large amount of data you might want to explore your data interactively and highlight a specific mark or group of marks while still maintaining the context of where those marks show in your view.
To do this you can turn on the Highlighter for one or more discrete fields that are included in your view and that affect the level of detail
Example – Here we just want to focus on Public Affairs college dimension, but don’t want to filter out or remove the rest of the data:
Chart, scatter chart
Description automatically generated
Note that filtering is not the correct option since that would REMOVE the data that doesn’t match the filtering criteria.
Reference: https://help.tableau.com/current/pro/desktop/en-us/actions_highlight_highlighter.htm
While borders and background colors let you visually highlight items on a dashboard, _________ lets you precisely space items.
- A . padding
- B . margining
- C . tiling
- D . spacing
A
Explanation:
Padding lets you precisely space items on dashboard, while borders and background colors let you visually highlight them. Inner padding sets the spacing between item contents and the perimeter of the border and background color; outer padding provides additional spacing beyond the border and background color.
Reference: https://help.tableau.com/current/pro/desktop/en-us/dashboards_organize_floatingandtiled.htm
Which of the following is not a Trend Line Model?
- A . Linear Trend Line
- B . Exponential Trend Line
- C . binomial Trend Line
- D . Logarithmic Trend Line
C
Explanation:
According to the official Tableau documentation, there are 5 types of trend lines which we can work with in Tableau:
1) Linear Trend Line
2) Logarithmic Trend Line
3) Exponential Trend Line
4) Polynomial Trend Line
5) Power Model
Hence, the correct answer is BINOMIAL trend line which is not present in Tableau.
See the following image:
For more information, refer to: https://help.tableau.com/current/pro/desktop/en-us/trendlines_add.htm
Which one of the following is a dimension?
- A . Longitude
- B . Measure Names
- C . Number of records
- D . Latitude
B
Explanation:
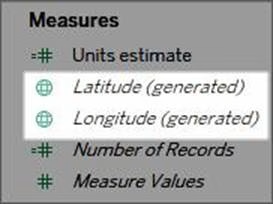
Measure Names is a dimension. Latitude, Longitude, and Number of records are all measures.
Reference: https://help.tableau.com/current/pro/desktop/en-us/datafields_understanddatawindow.htm
You want to add Custom shapes to your visualisation. Where can you add these new shapes?
- A . In Downloads -> My Tableau Repository -> Shapes
- B . In My Computer -> C: -> Tableau -> Shapes
- C . In Program Files -> Tableau -> Shapes
- D . In My Documents -> My Tableau Repository -> Shapes
D
Explanation:
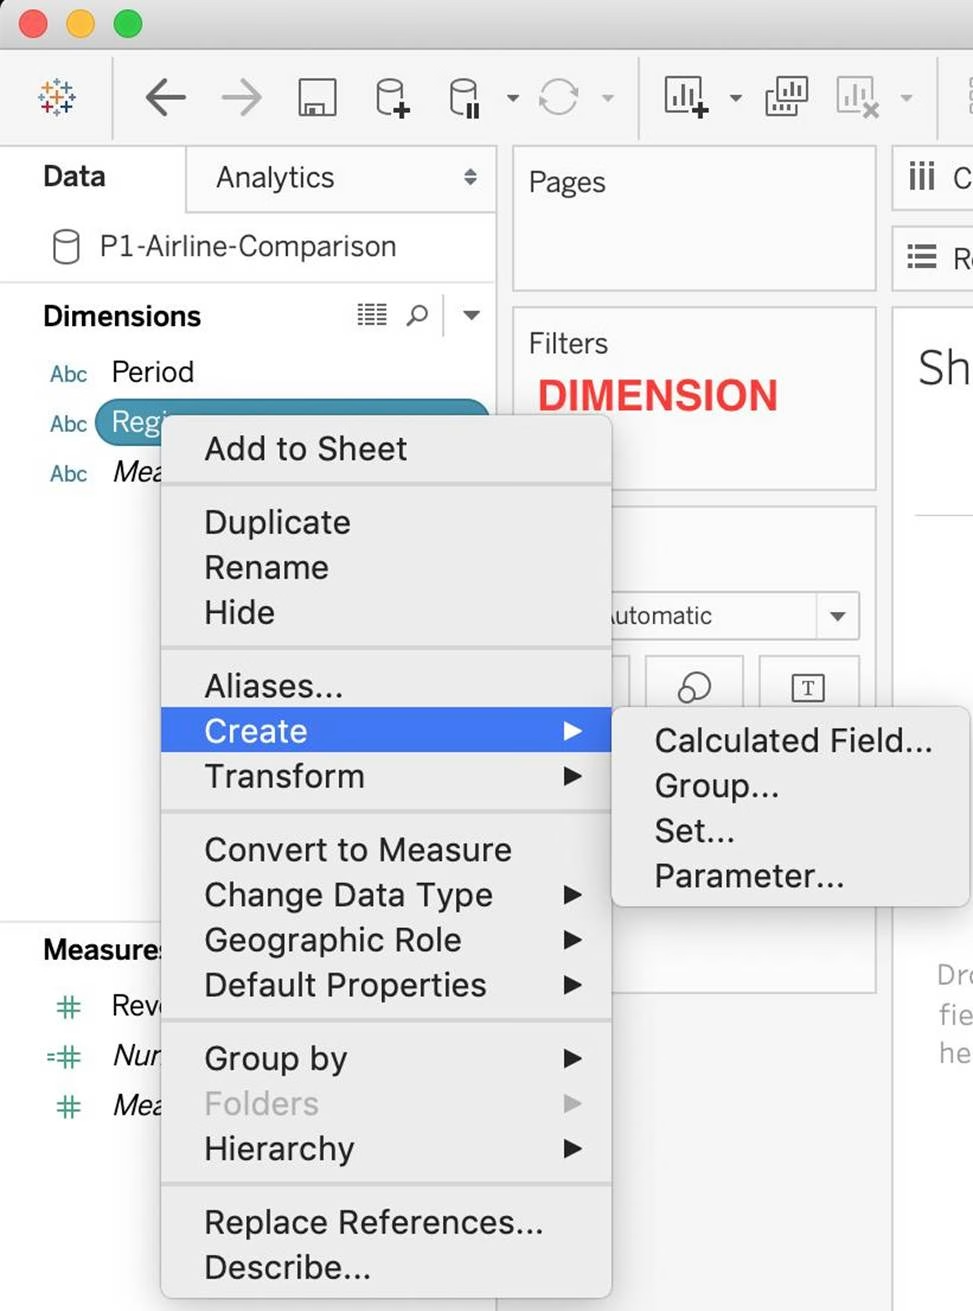
Here’s how to add image files to your repository:
1) Find image file on the internet. I try to find consistent image formats if I plan to use a set of shapes such as logos or flags.
2) Download the image to your computer.
3) Drag images into your My Documents -> My Tableau repository -> Shapes folder.
4) Open Tableau and your new shapes will automatically be included in your "edit shapes" menu.
Reference: https://www.tableau.com/about/blog/2016/2/how-use-custom-shapes-filters-your-dashboard-50200
_____________ charts are typically used to represent accumulated totals over time and
are the conventional way to display stacked lines.
- A . Line
- B . Area
- C . Gantt
- D . Bullet
B
Explanation:
According to the official Tableau documentation:
An example of an area chart is shown below:
How can you change the default Tableau repository location?
- A . By clicking on Window -> Repository Location
- B . By clicking on Help -> Change Repository Location
- C . By clicking on File -> Repository Location and choosing a new location
- D . By Moving the repository location manually to wherever we want
C
Explanation:
According to the official Tableau documentation:
Graphical user interface, text, application
Description automatically generated
Reference: https://help.tableau.com/current/pro/desktop/en-us/environ_filesandfolders.htm