Tableau TDS-C01 Tableau Desktop Specialist Online Training
Tableau TDS-C01 Online Training
The questions for TDS-C01 were last updated at Apr 07,2025.
- Exam Code: TDS-C01
- Exam Name: Tableau Desktop Specialist
- Certification Provider: Tableau
- Latest update: Apr 07,2025
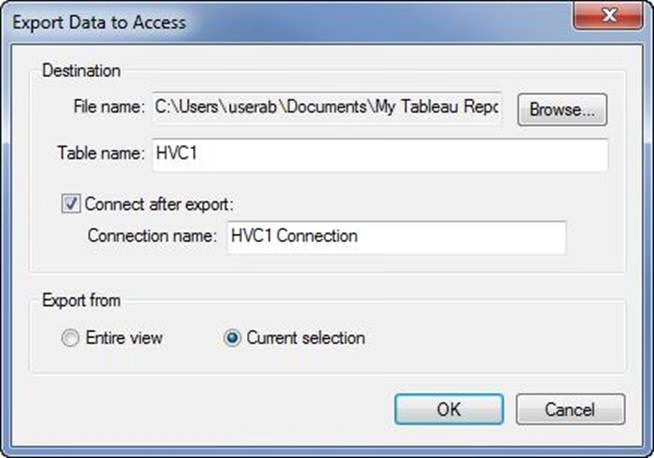
Which of the following are the options to export the data used to build the view / visualisations?
- A . CSV file
- B . PDF File
- C . JSON format
- D . MS Access Database
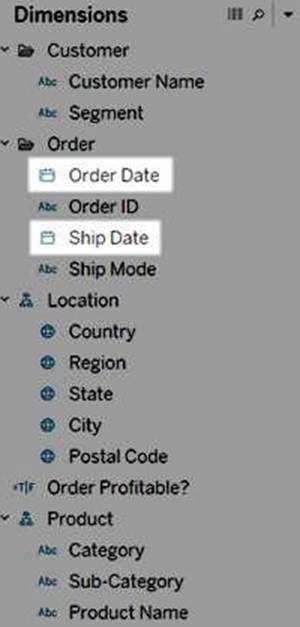
Dates in Tableau are typically treated as ______________
- A . Dimensions
- B . Measures
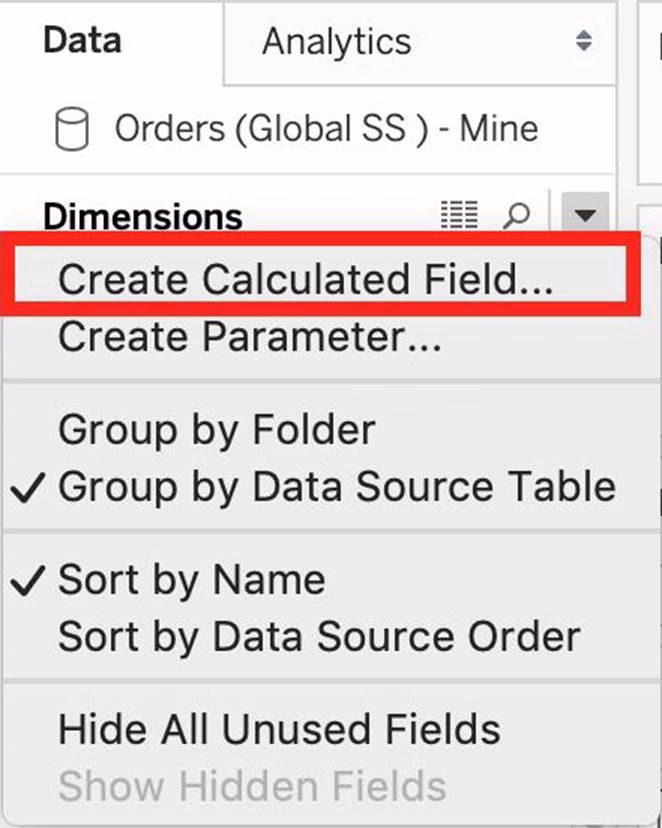
You can use the __________________ in Tableau to clean / organise your data.
- A . Data cleaner
- B . Data manager
- C . Data interpreter
- D . Data organiser

Larger image
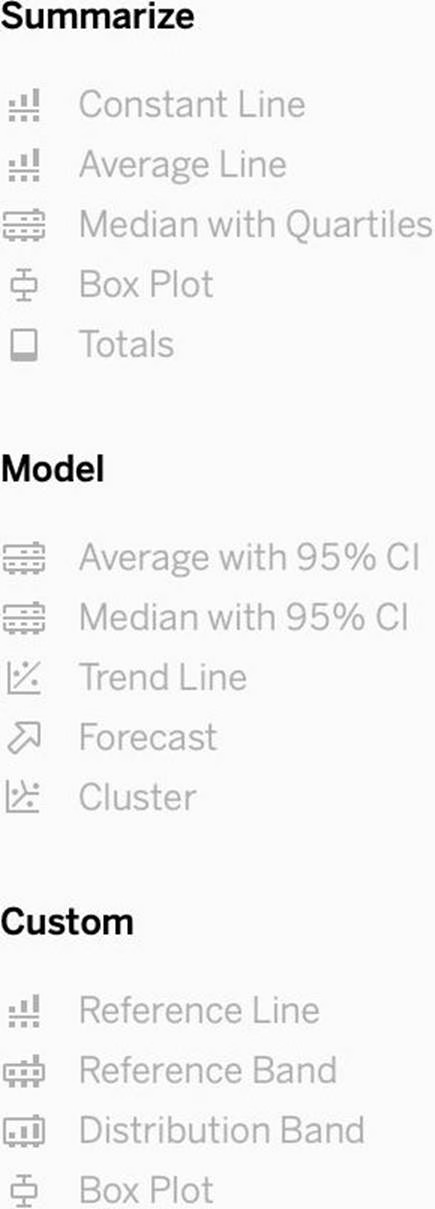
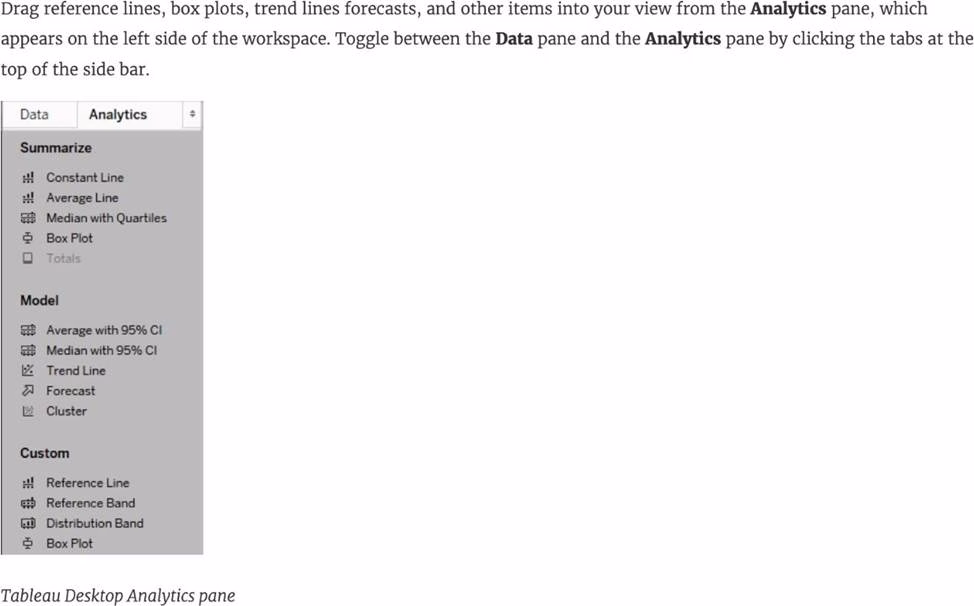
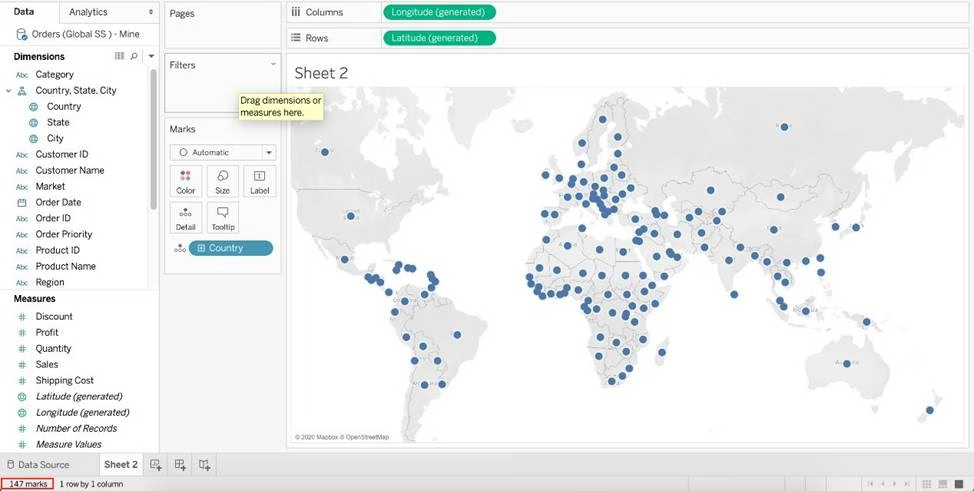
What is this entire view referred to as in Tableau?
- A . Data pane
- B . Analytics Pane
- C . Summary Pane
- D . Distribution Pane
DOWNLOAD THE DATASET FROM – https://drive.google.com/file/d/1F8L_Rl5B9LAz8RDi-DdjWx3Iv-SgzaBq/view?usp=sharing ( if you haven’t already from the test instructions page! )
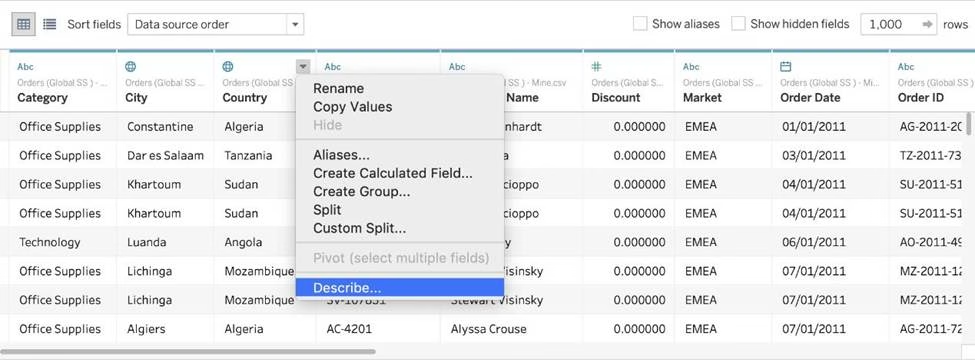
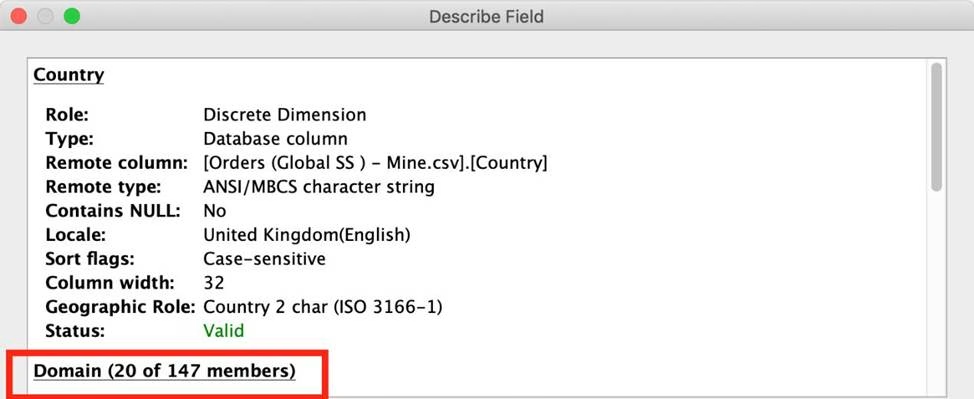
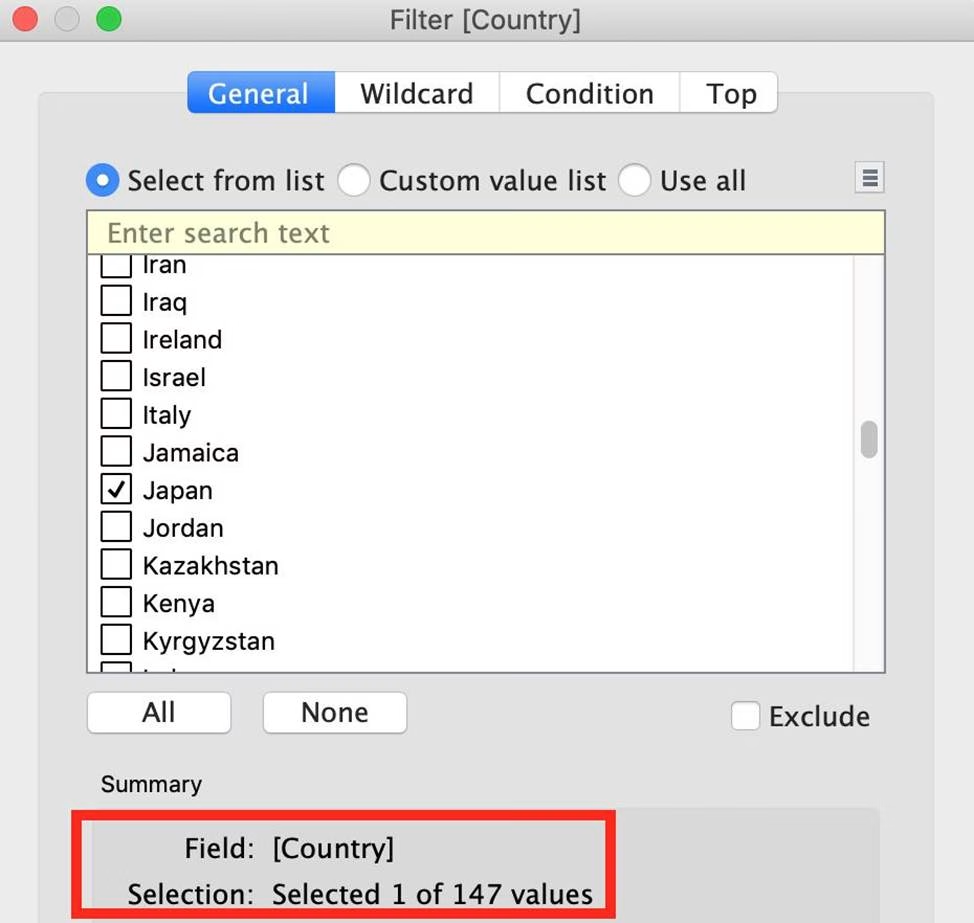
How many different countries are present in the dataset?
- A . 150
- B . 147
- C . 140
- D . 156
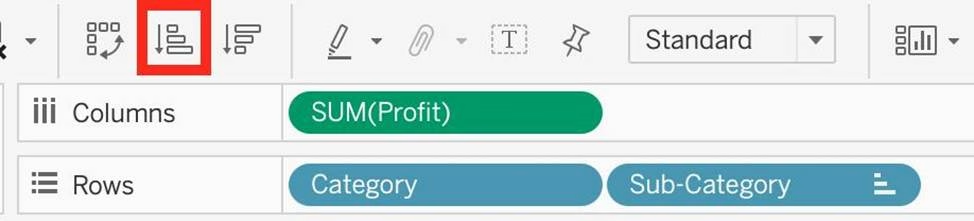
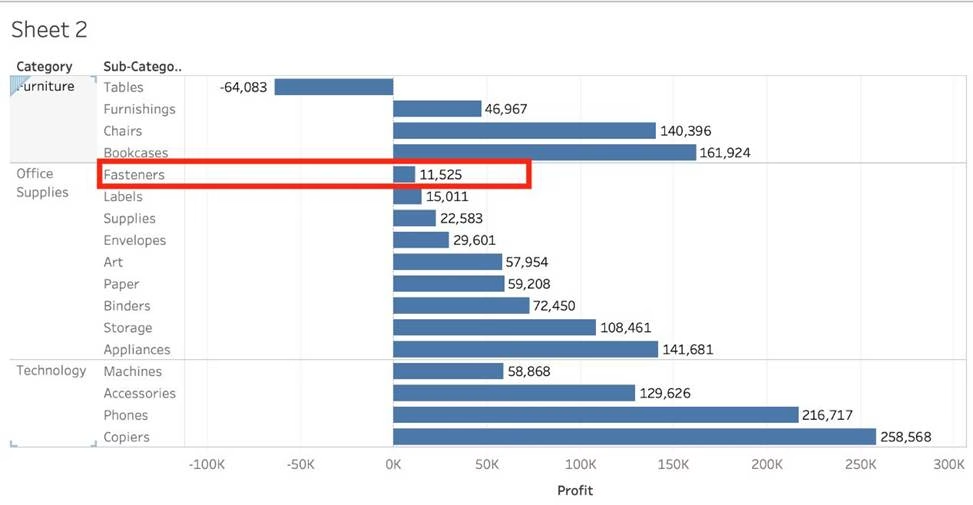
Which Sub-Category had the least Profit in the Office Supplies category?
- A . Fasteners
- B . Labels
- C . Envelopes
- D . Binders
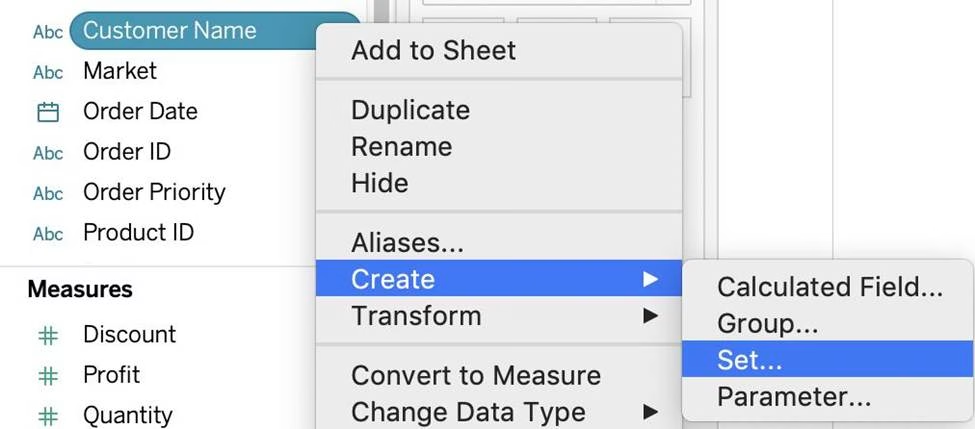
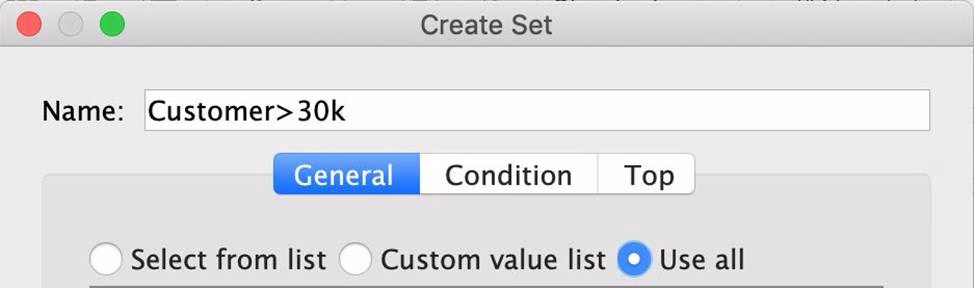
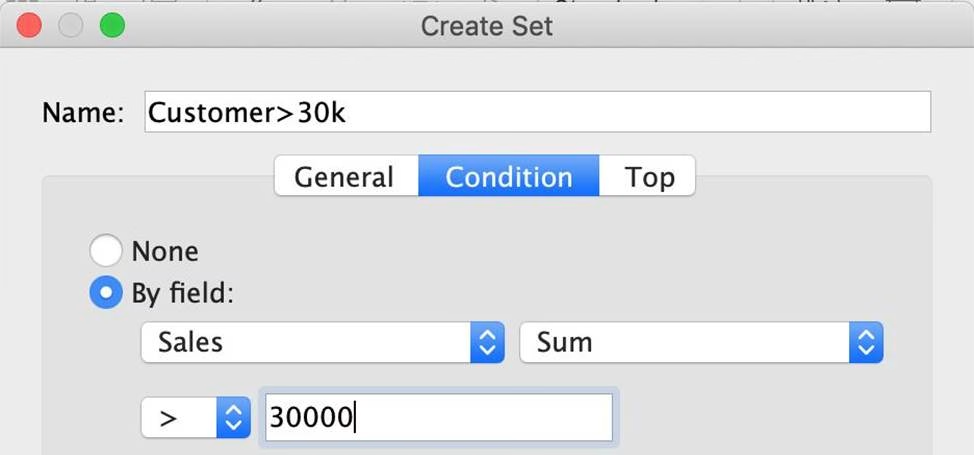
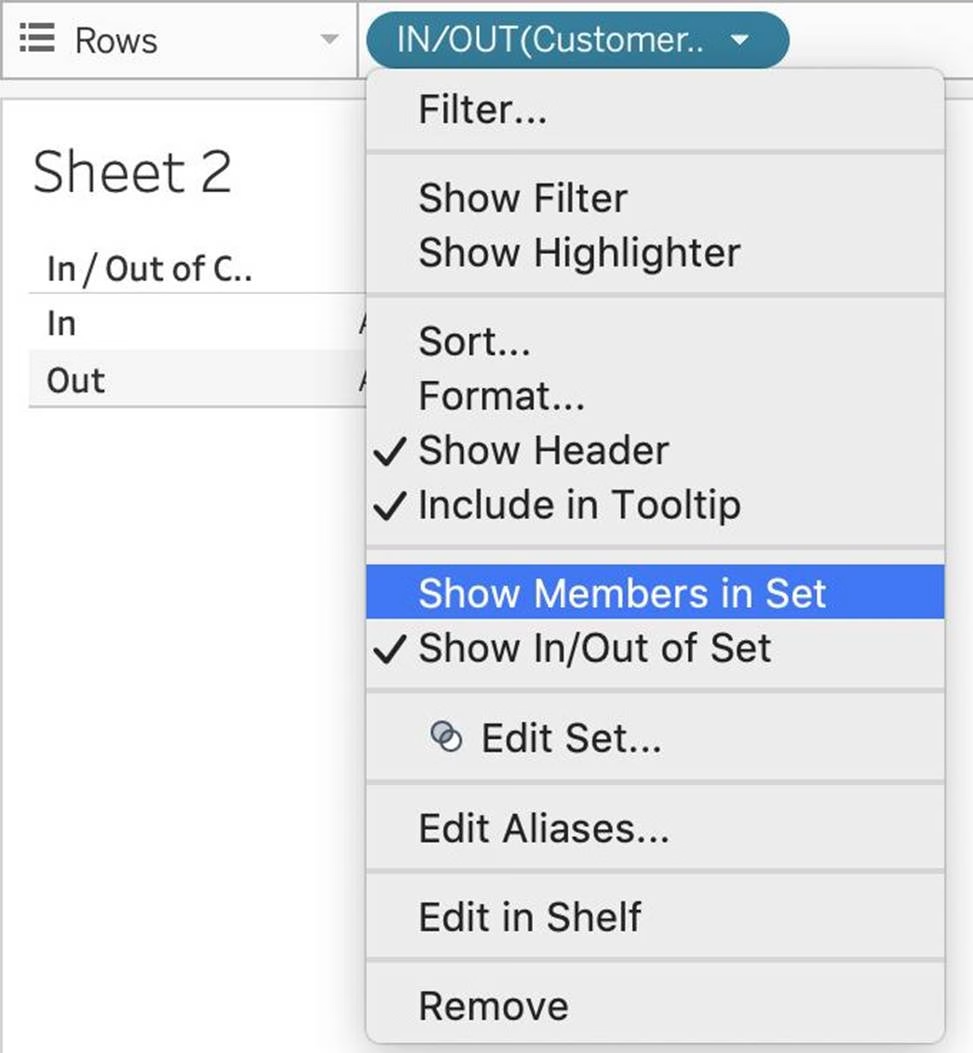
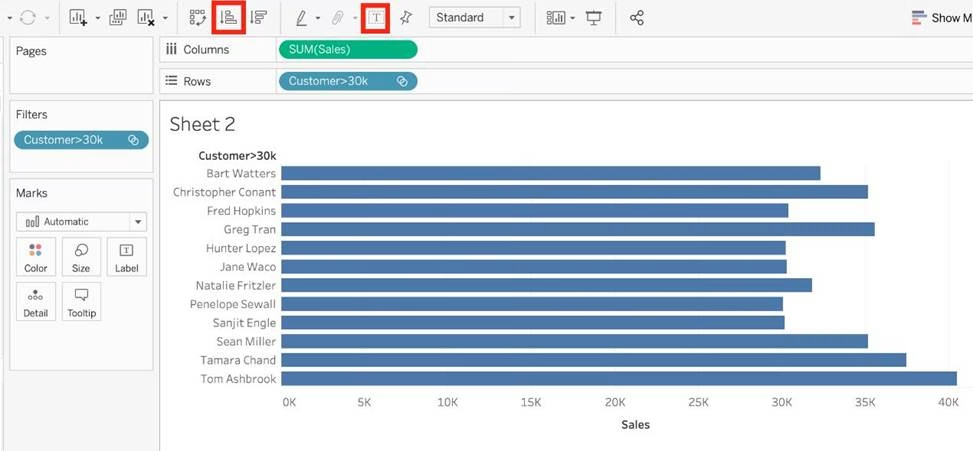
Create a Set containing Customer Names whose Sales are GREATER than 30,000.
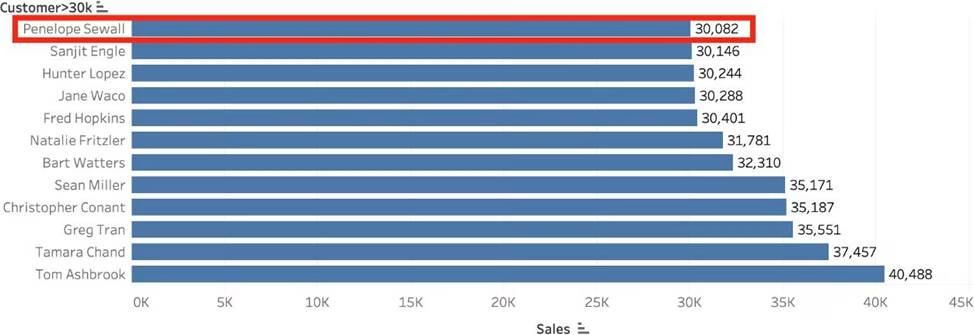
Which customer had the LEAST sales in this set?
- A . Tom Ashbrook
- B . Sanjit Engle
- C . Penelope Sewall
- D . Tamara Chand

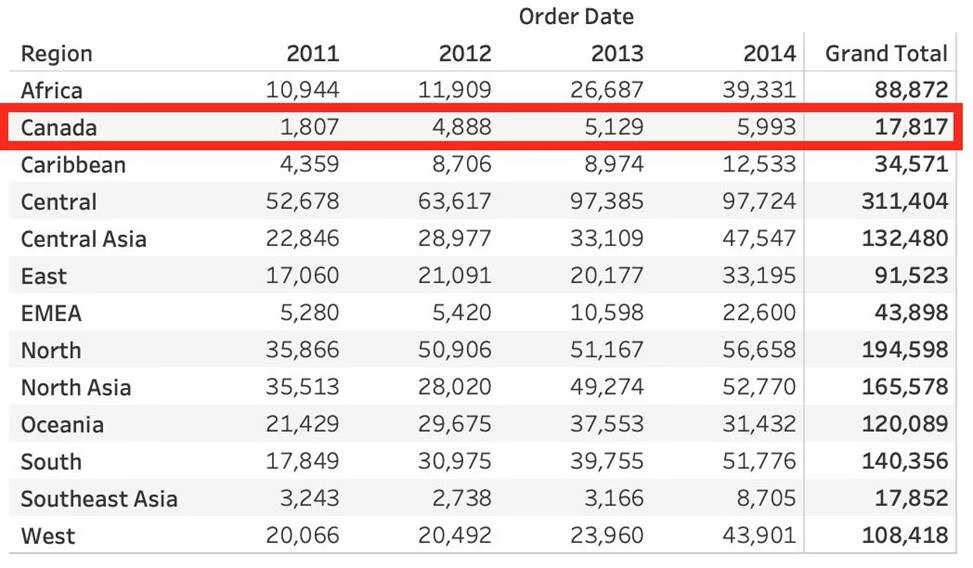
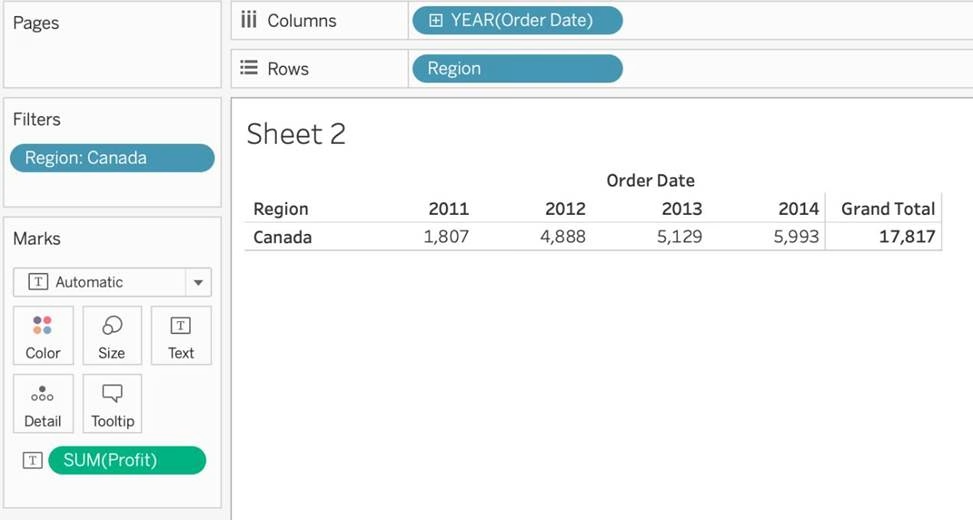
Using the dataset provided, create a crosstab showing the Profit of each Region per Year, then add grand totals to the view.
What was the total Profit for Canada in 2012 and the total Profit for Canada for 2011 through 2014, respectively?
- A . 5,129 and 88,872
- B . 52,678 and 311,404
- C . 1,807 and 34,571
- D . 4,888 and 17,817

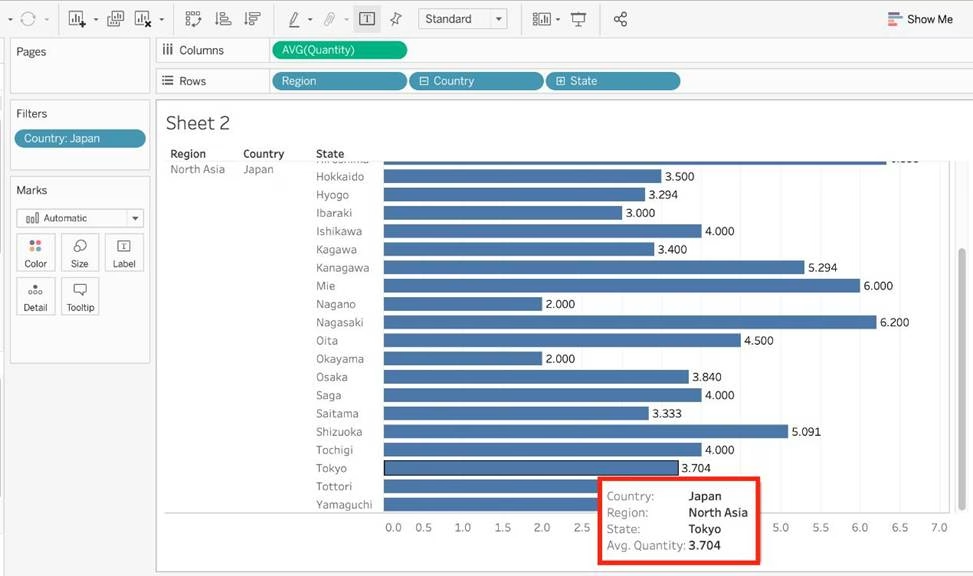
Using the dataset, create a bar chart showing the average Quantity broken down by Region, and filtered by Country to only show Japan.
What was the average Quantity in the State of Tokyo?
- A . 3.000
- B . 3.840
- C . 3.704
- D . 3.500
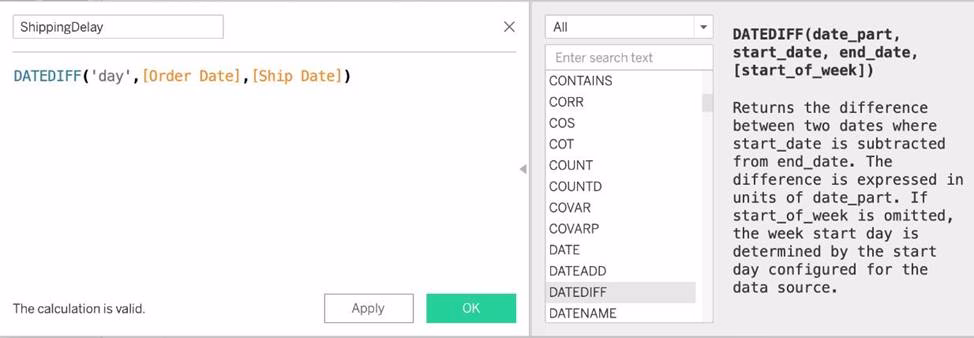
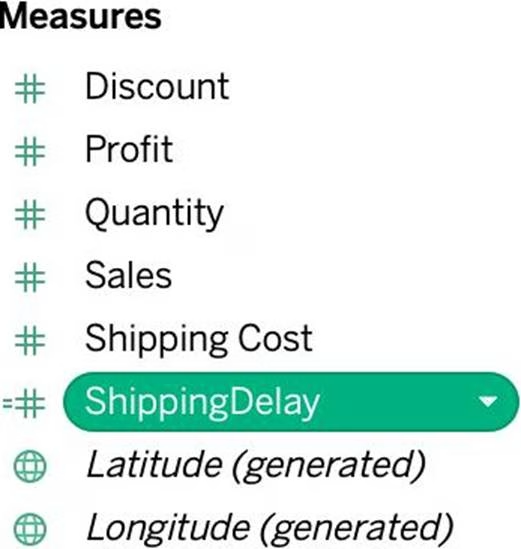
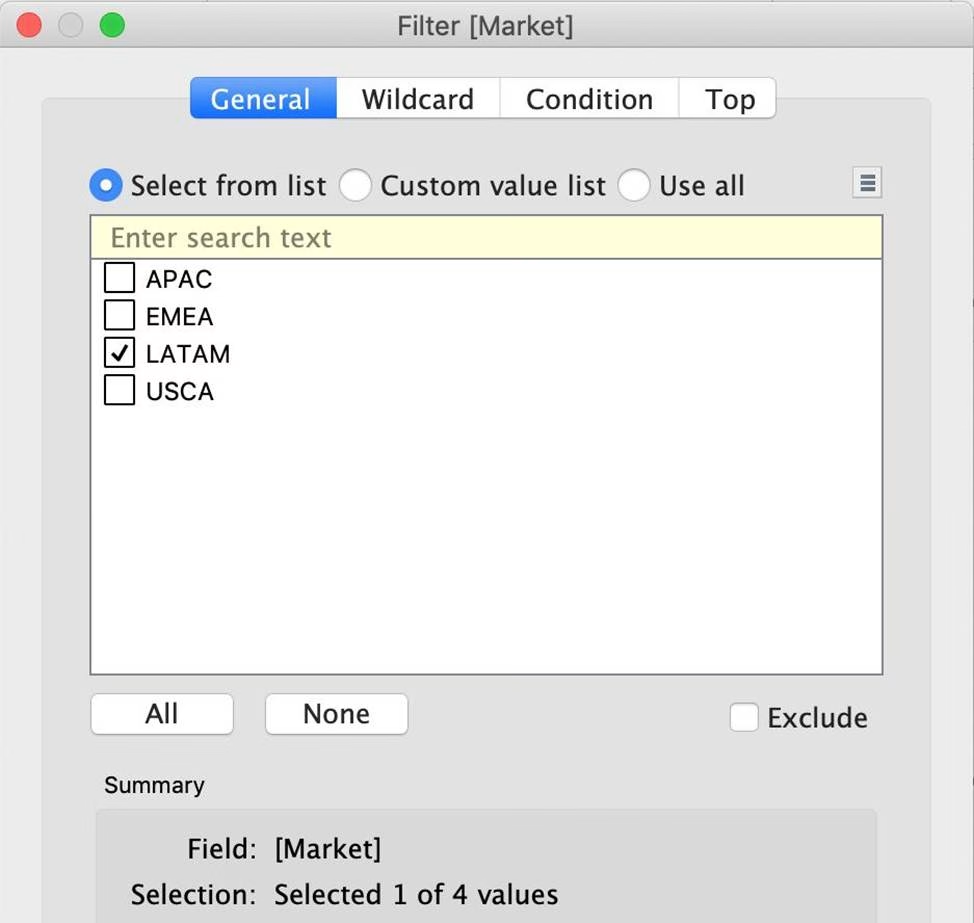
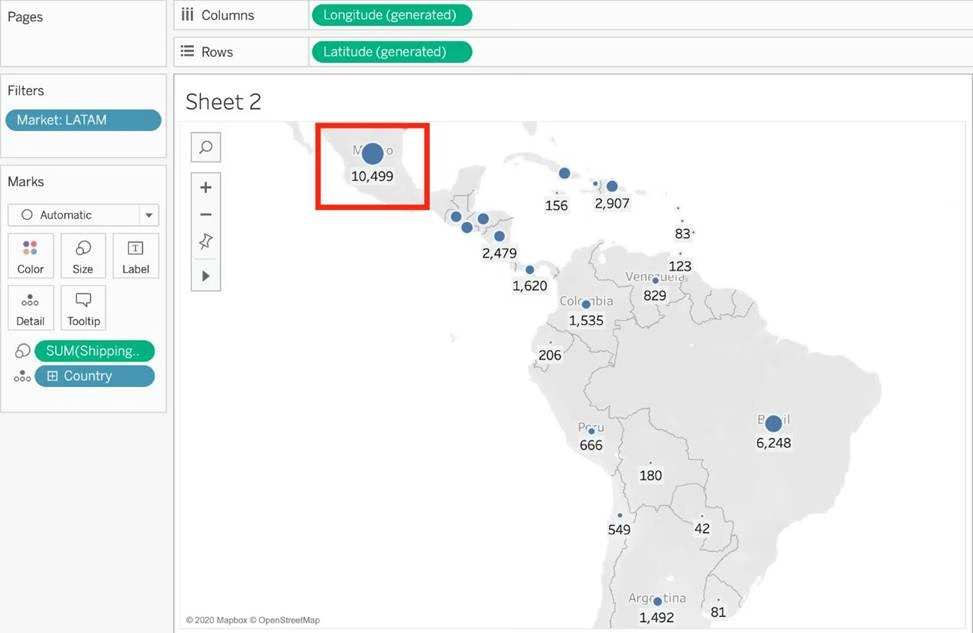
Using the dataset, plot a Map showing all the countries, filtered by Market to only include LATAM.
Which country in the LATAM Market has the highest shipping delay (sum of total number of days between the order date and the ship date)?
- A . Brazil
- B . Peru
- C . Argentina
- D . Mexico
Latest TDS-C01 Dumps Valid Version with 151 Q&As
Latest And Valid Q&A | Instant Download | Once Fail, Full Refund
