Tableau TDS-C01 Tableau Desktop Specialist Online Training
Tableau TDS-C01 Online Training
The questions for TDS-C01 were last updated at Mar 29,2026.
- Exam Code: TDS-C01
- Exam Name: Tableau Desktop Specialist
- Certification Provider: Tableau
- Latest update: Mar 29,2026
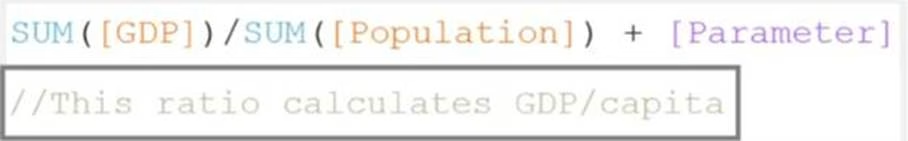
How would you calculate GDP per capita in Tableau?
- A . SUM([GDP]/[POPULATION])
- B . SUM([Population]/[GDP]])
- C . SUM([GDP]*[POPULATION])
- D . SUM([GDP]) / SUM([Population])
_______________ enables us to create workbooks and views, dashboards, and data sources in Tableau Desktop, and then publish this content to our own server.
- A . Tableau Server
- B . Tableau Prep
- C . Tableau Public
- D . Tableau myServer
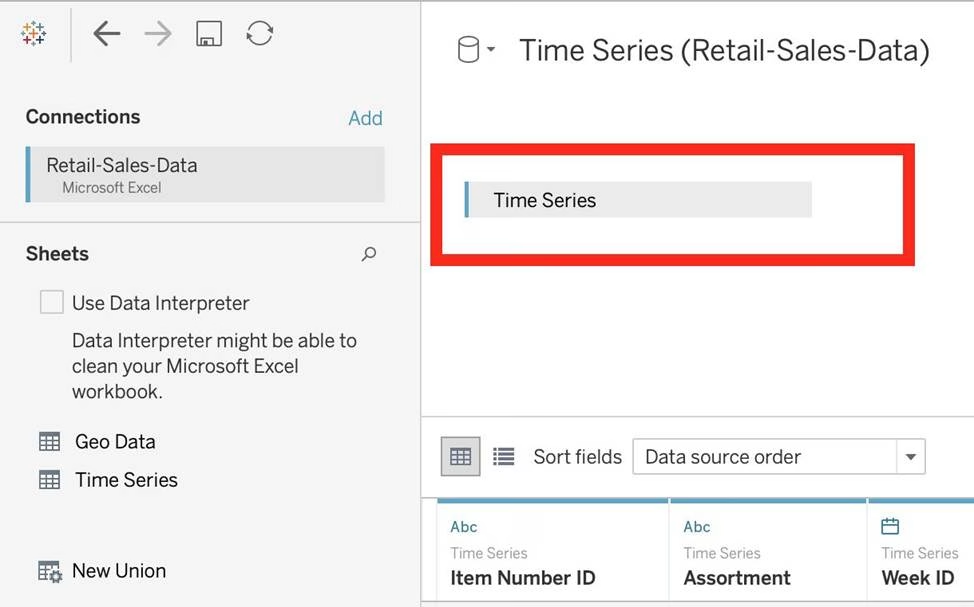
Download the Dataset from:
https://drive.google.com/file/d/12AYHfiPWkwBmvH0zbumOURgUX6Az00Rw/view?usp=sharing
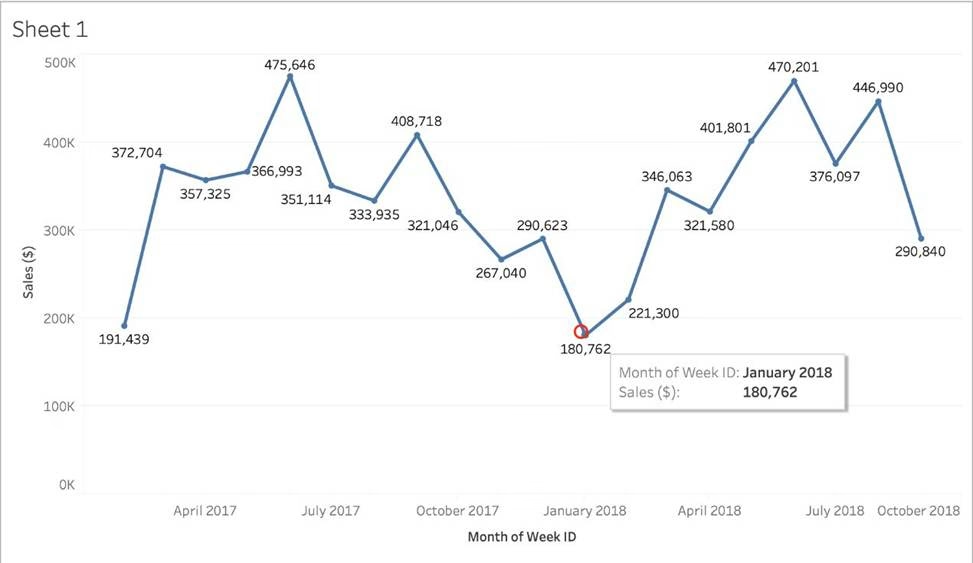
Using the Time Series Table, create a line chart to show Sales over time.
Which Month and Year witnessed the lowest Sales?
- A . September 2017
- B . March 2018
- C . December 2017
- D . January 2018
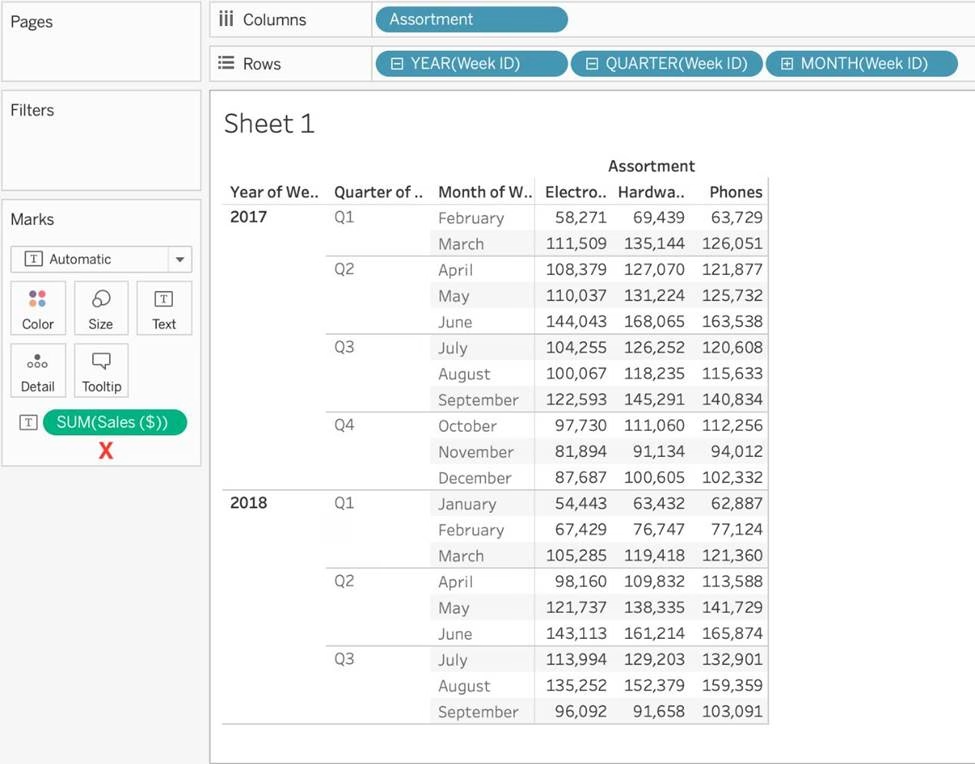
Using the Time Series table, create a cross-tab showing sales for each Assortment broken down by Year and Quarter.
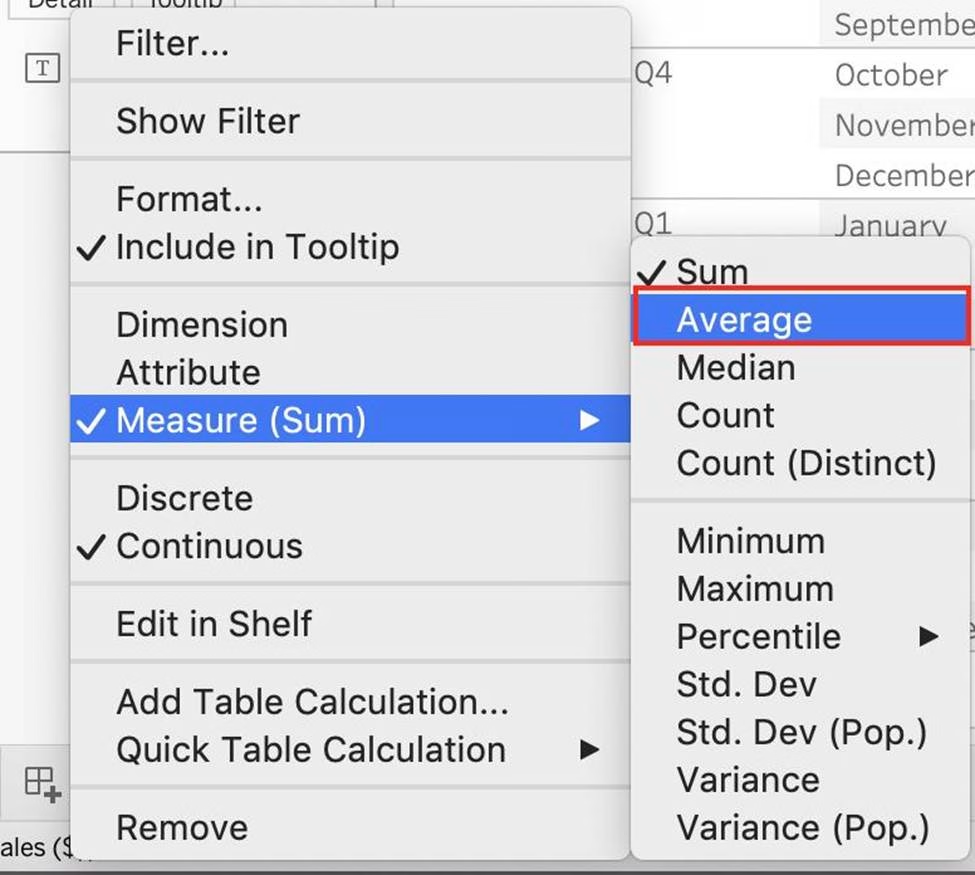
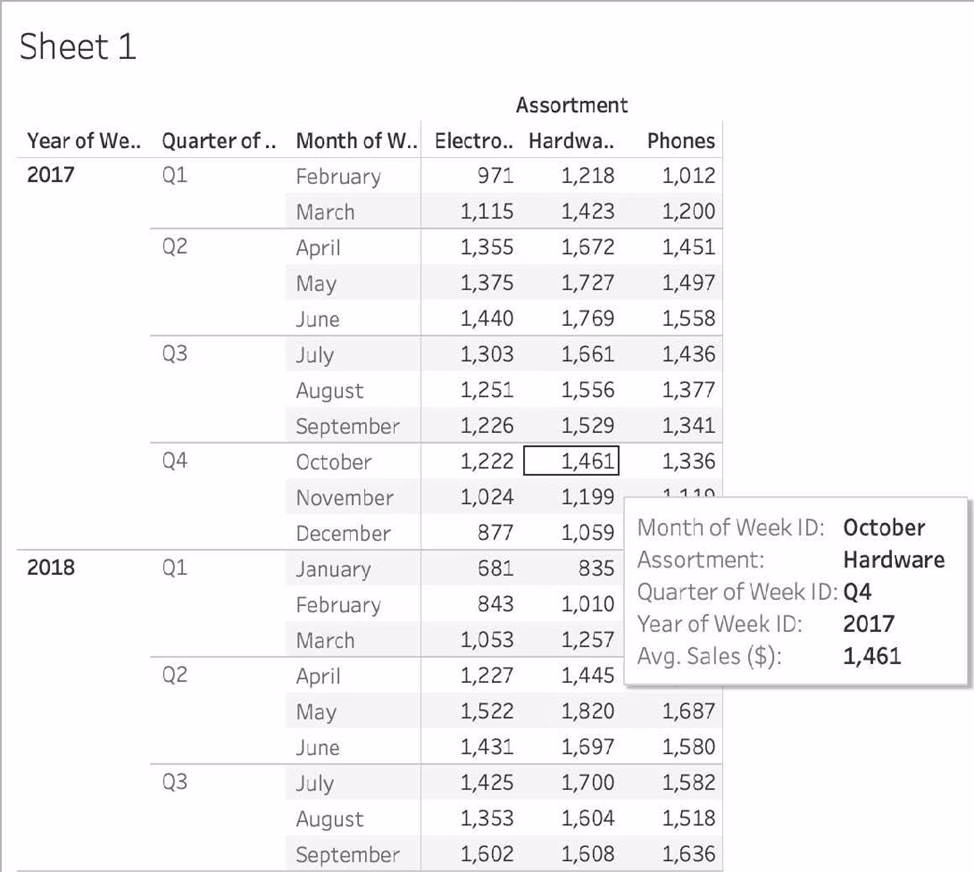
In Q4 of October 2017, what was the Average sales amount for the Hardware assortment?
- A . 111,060
- B . 1,461
- C . 112,256
- D . 1,222
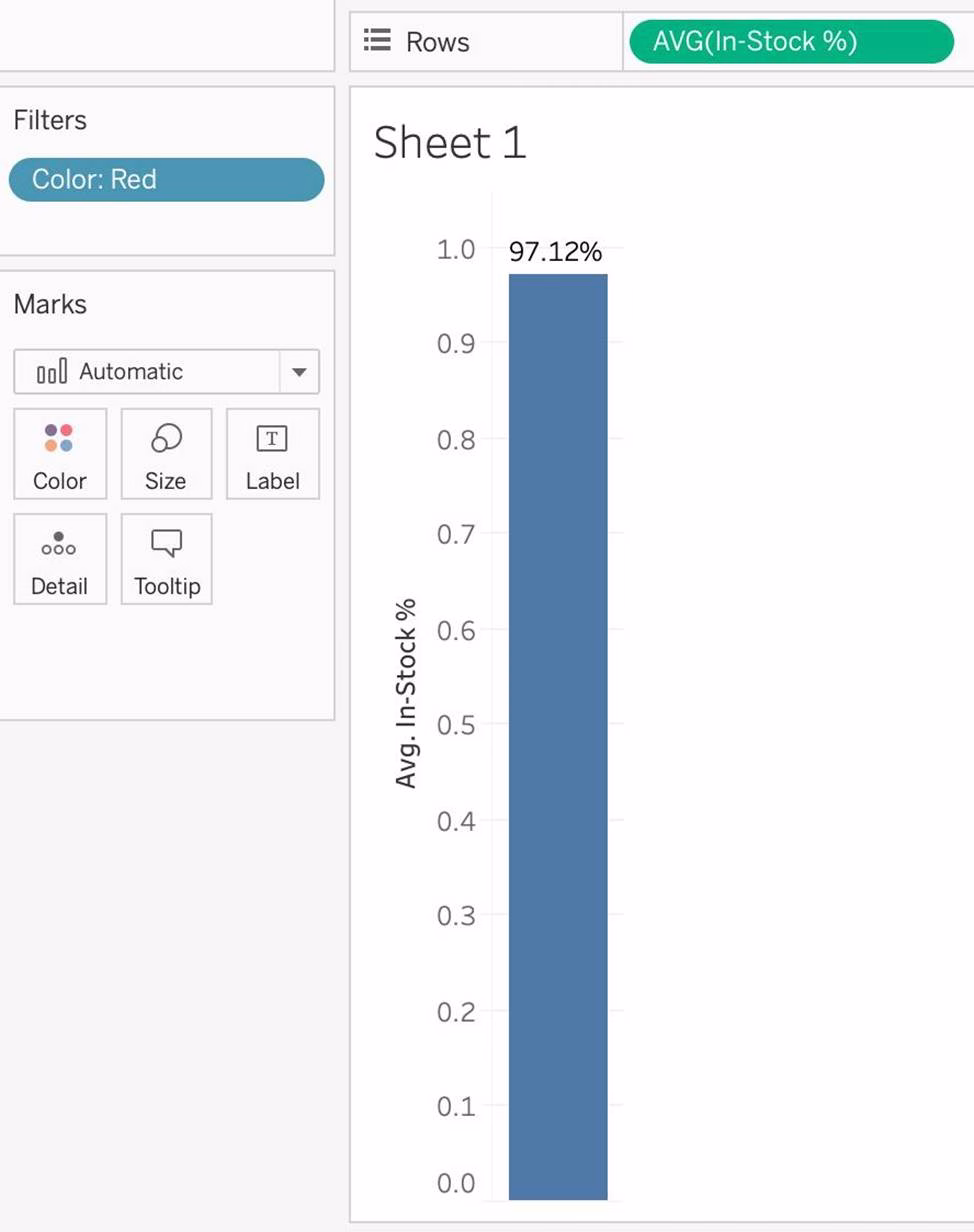
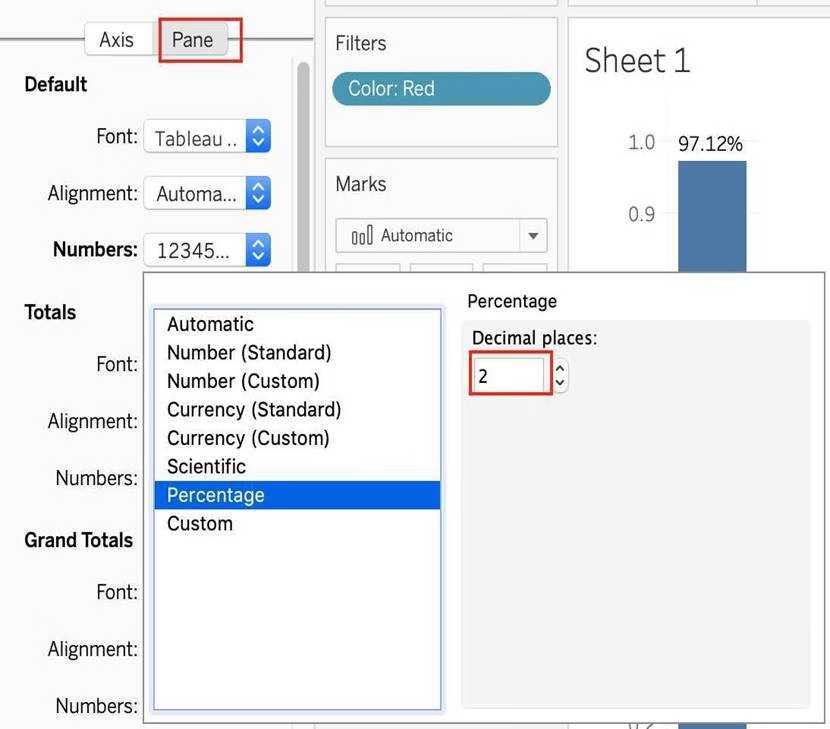
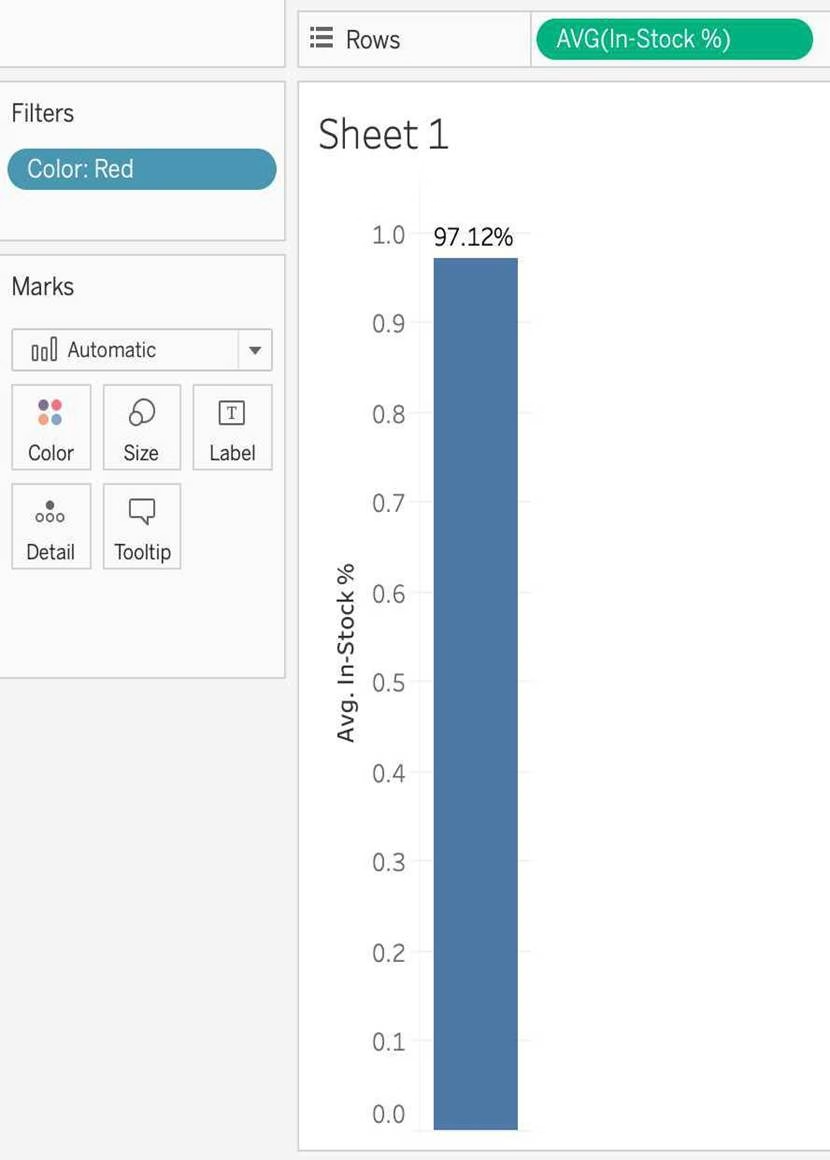
Using the Geo Data table, create a Bar chart showing the In-Stock percentage for each Color.
What is the Average In-Stock percentage for the Color Red? Present your answer correctly upto 2 decimal places.
- A . 96.46%
- B . 95.12%
- C . 97.12%
- D . 99.46%

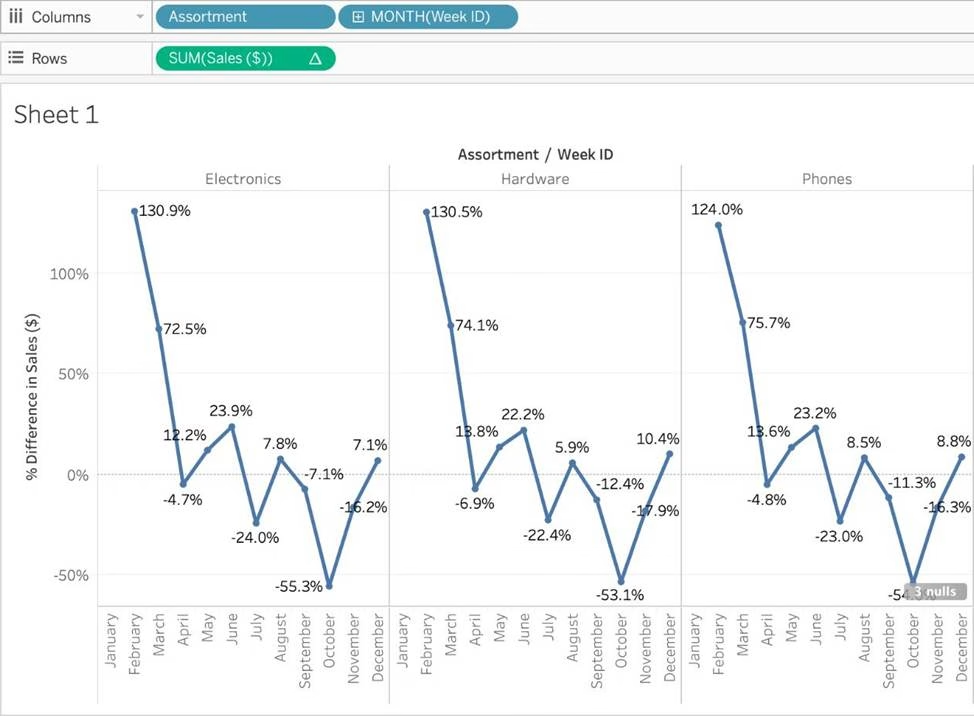
Using the Time Series Table, create a Line chart showing the Monthly Year over Year Growth for the Sales, broken down by Assortment.
For the Electronics assortment, which Month had the most NEGATIVE value of Year over Year Growth?
- A . October
- B . September
- C . July
- D . June
Using the Time Series Table, create a Line chart showing the Monthly Year over Year Growth for the Sales, broken down by Assortment.
For the Electronics assortment, which Month had the most NEGATIVE value of Year over Year Growth?
- A . October
- B . September
- C . July
- D . June
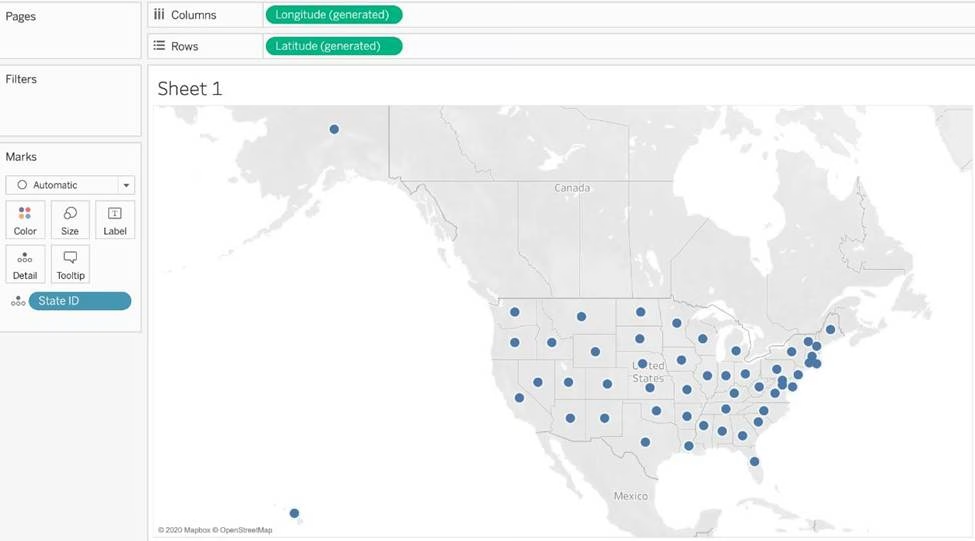
What was the Store count in 2017 for Texas (TX)?
Skipped Join the Geo Data and Time Series Table on the Item Number ID column, and display the Store count for every State on a Map.
What was the Store count in 2017 for Texas (TX)?
- A . 592,593
- B . 293,202
- C . 416,702
- D . 336,908
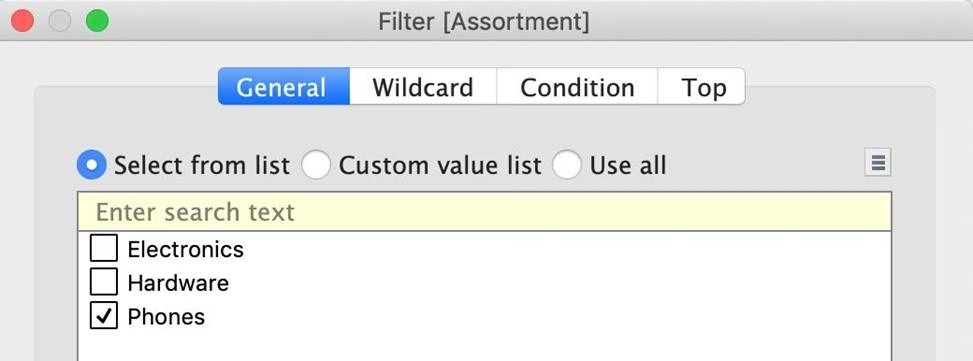
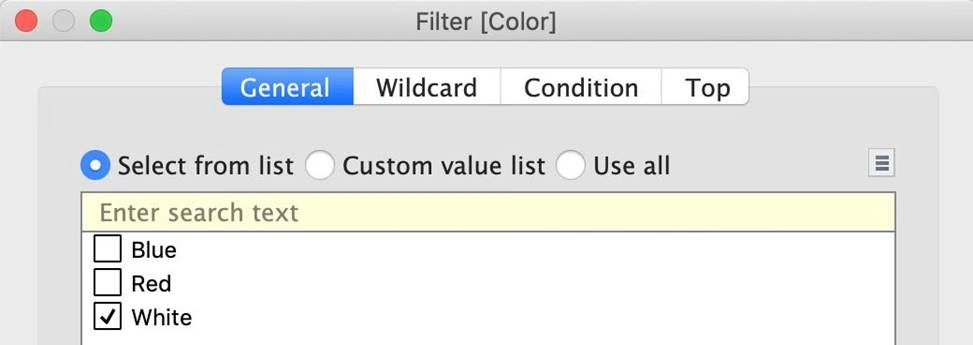
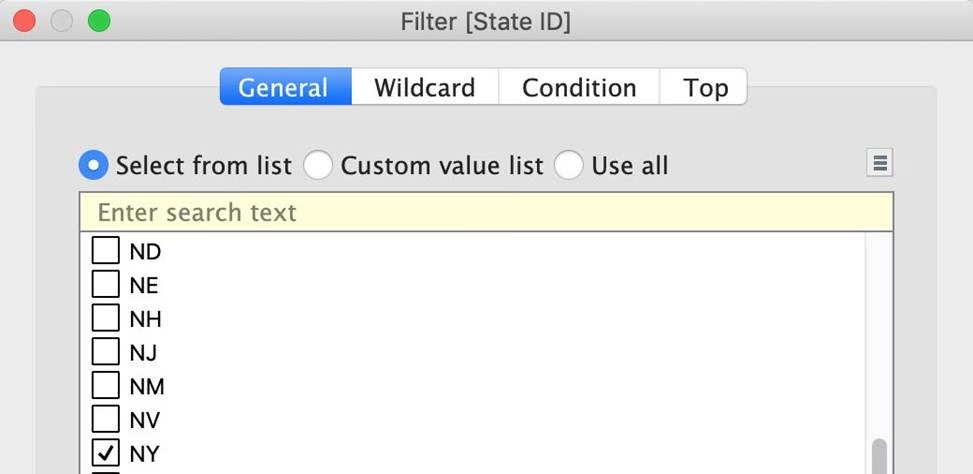
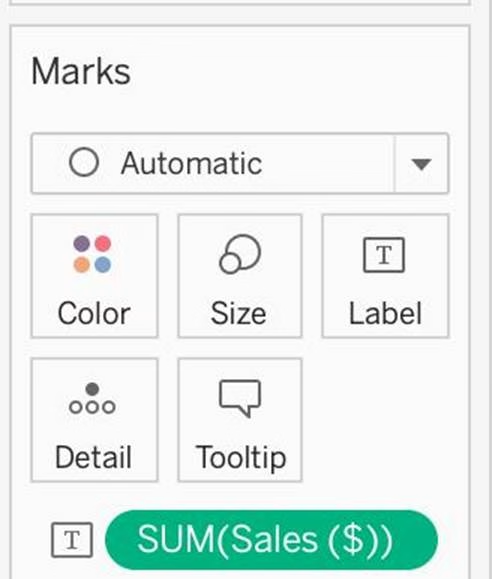
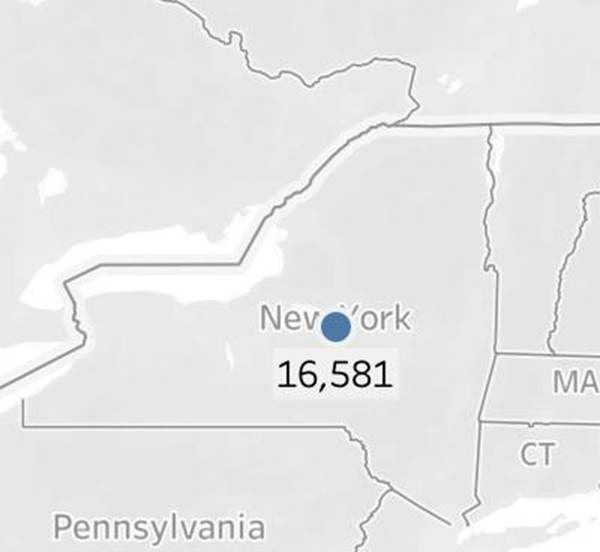
Using the Geo Data Table, create a Map showing Sales made per State.
For the State of New York (NY), what was the amount in Sales ($) made for Phone Assortments with White color?
- A . $16,581
- B . (Correct)
- C . $147,950
- D . $48,115
- E . $33,768
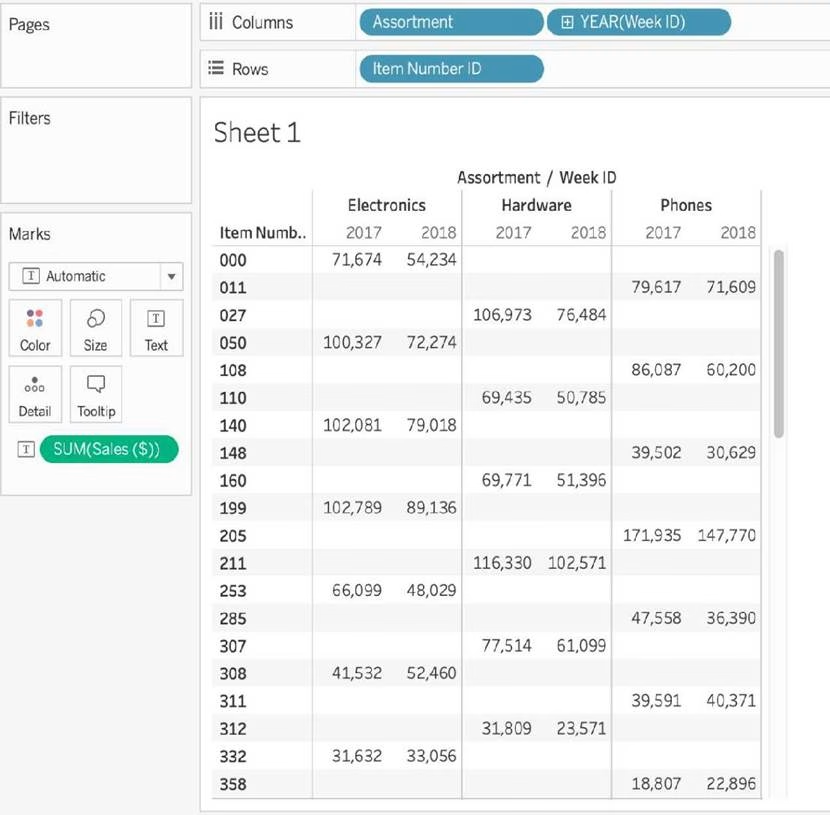
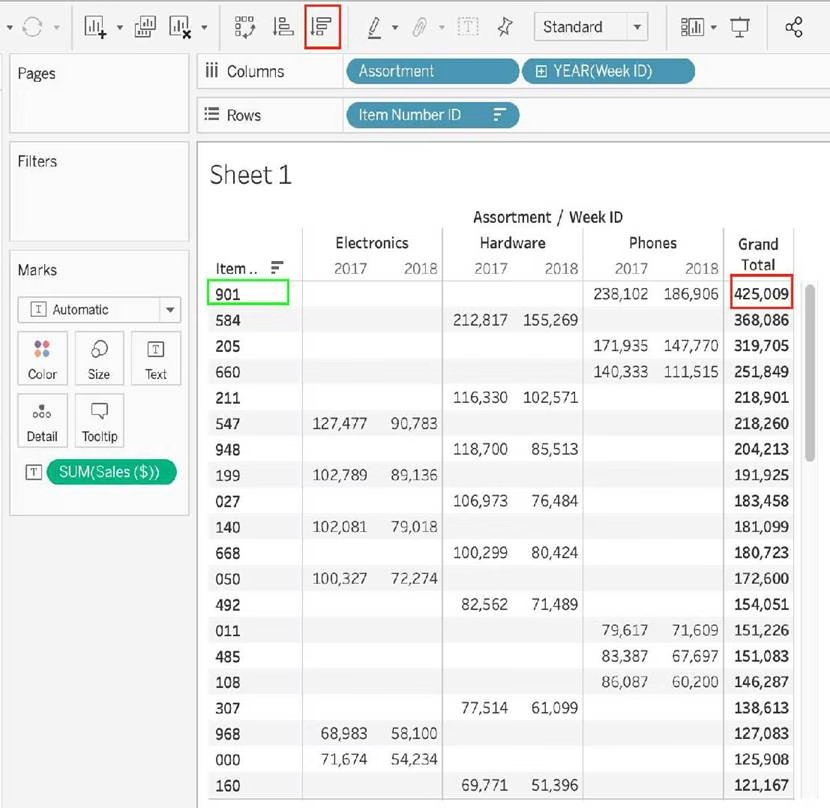
Using the Time-series table, create a cross tab showing the Sales for each Item Number-ID, broken down by Assortments, then add Grand totals to the view.
Which Item Number ID made the maximum sales across all assortments?
- A . 584
- B . 901
- C . Correct)
- D . 205
- E . 660
Latest TDS-C01 Dumps Valid Version with 151 Q&As
Latest And Valid Q&A | Instant Download | Once Fail, Full Refund
