Tableau TDS-C01 Tableau Desktop Specialist Online Training
Tableau TDS-C01 Online Training
The questions for TDS-C01 were last updated at Mar 07,2026.
- Exam Code: TDS-C01
- Exam Name: Tableau Desktop Specialist
- Certification Provider: Tableau
- Latest update: Mar 07,2026
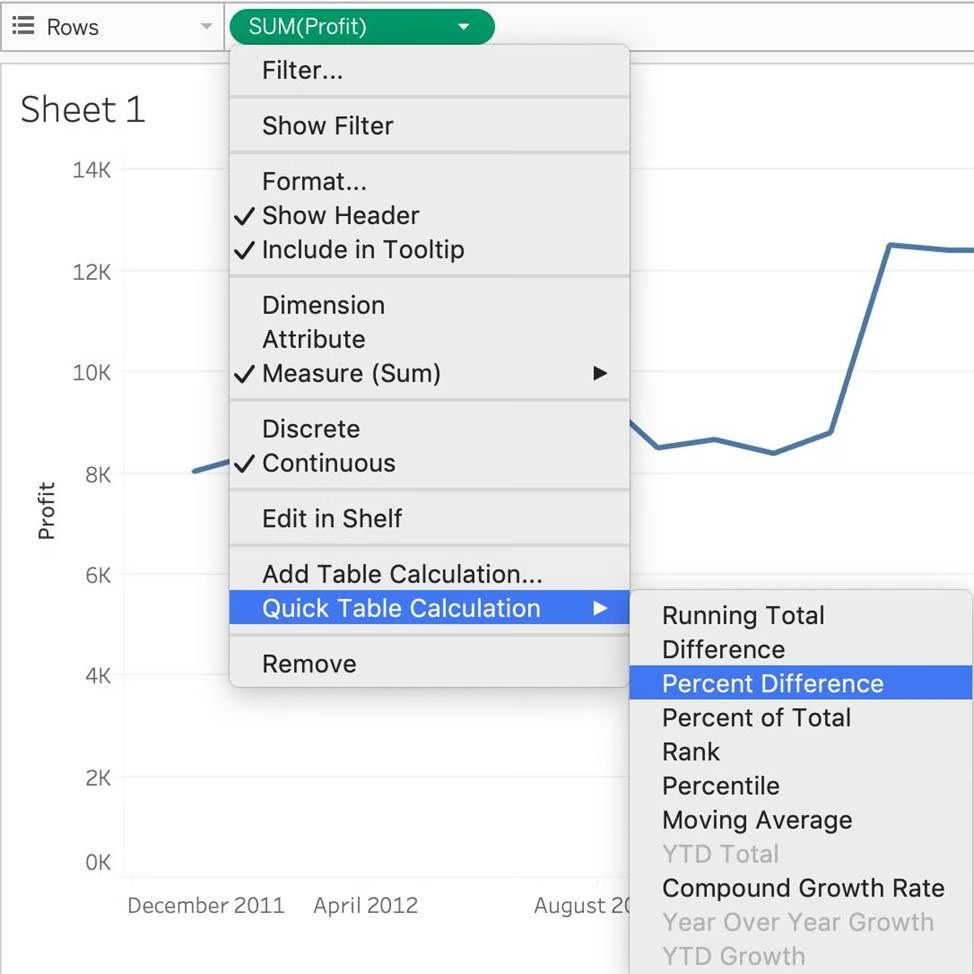
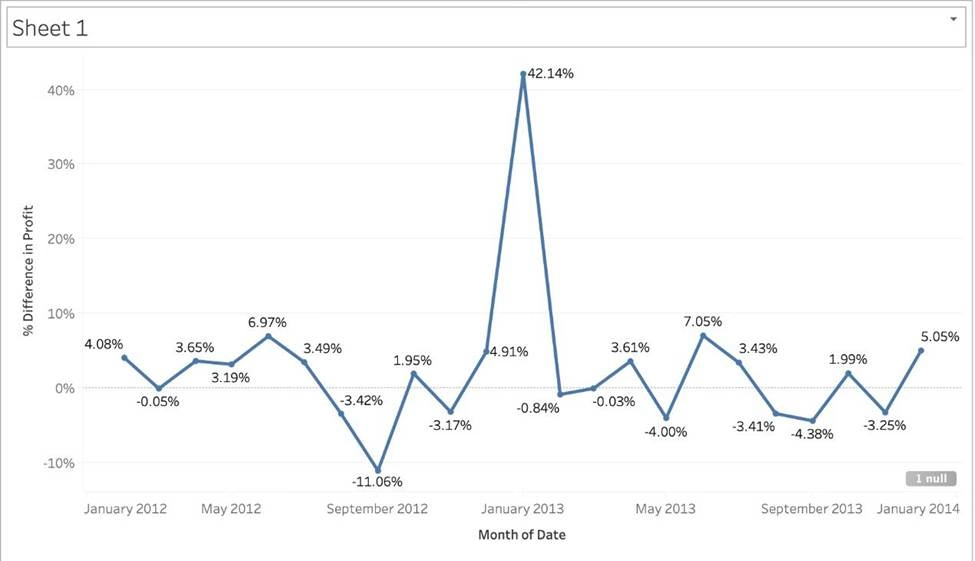
Using the CoffeeChain table, create a chart to see the monthly Percent difference change in Profit, from the beginning of 2012 to the end of 2013.
How many months saw a Negative percent difference in Profit?
- A . 9
- B . 7
- C . 10
- D . 8

Question 30: Skipped
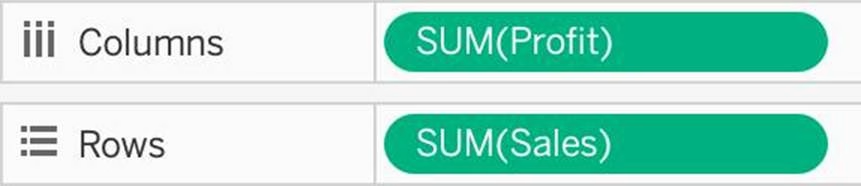
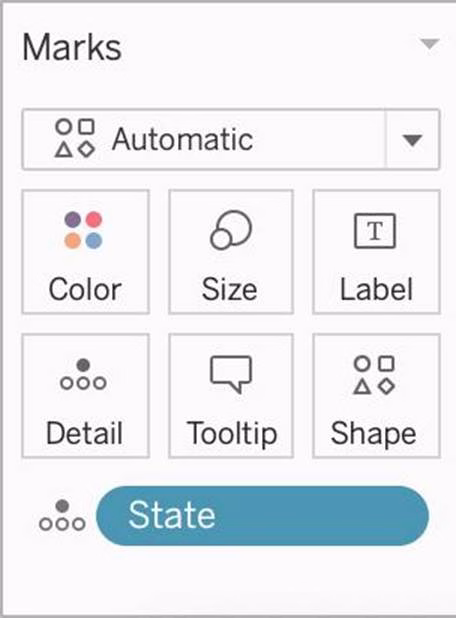
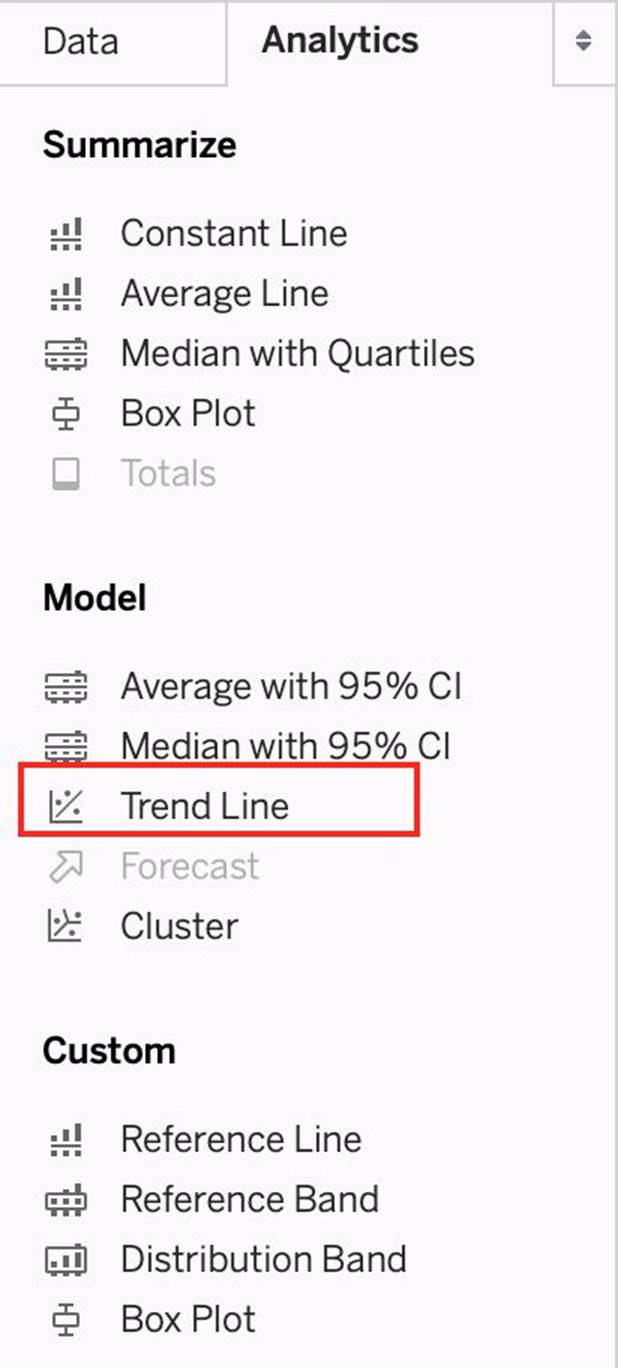
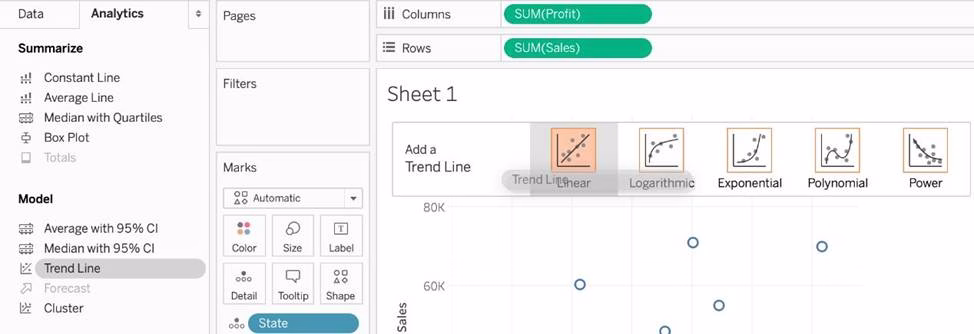
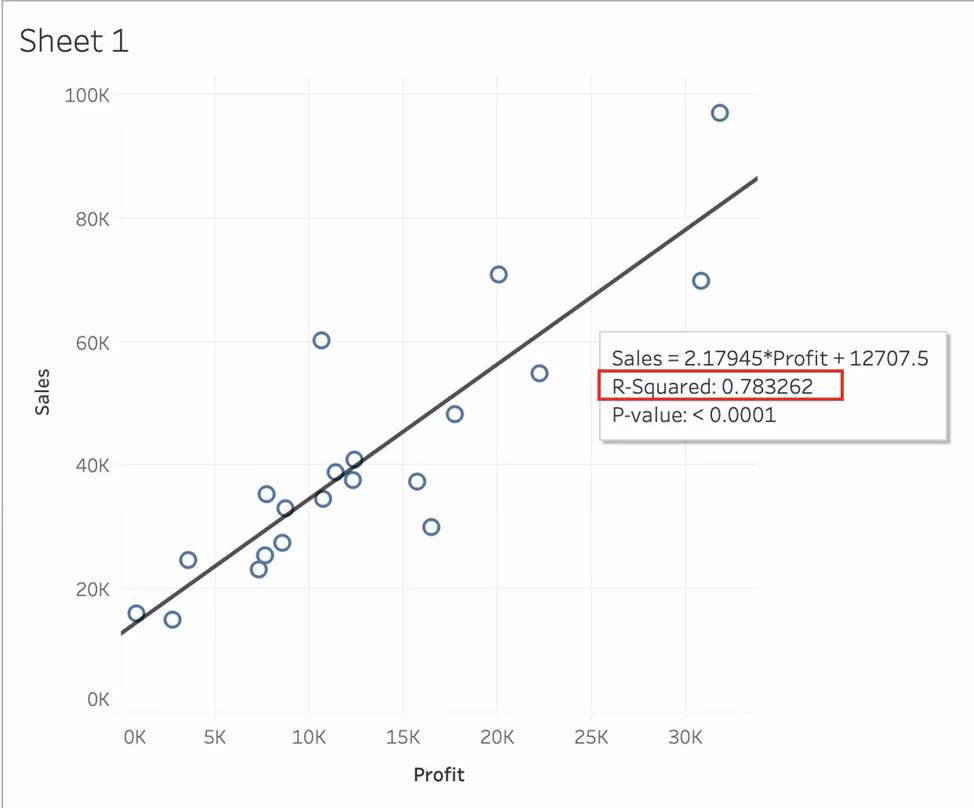
Using the CoffeeChain table, create a scatter plot of Profit (x-axis) vs Sales (y-axis) broken down by State. Add a Linear trend line to the view.
What is its R-squared value?
- A . 0.783262
- B . 0.739284
- C . 0.759329
- D . 0.748472
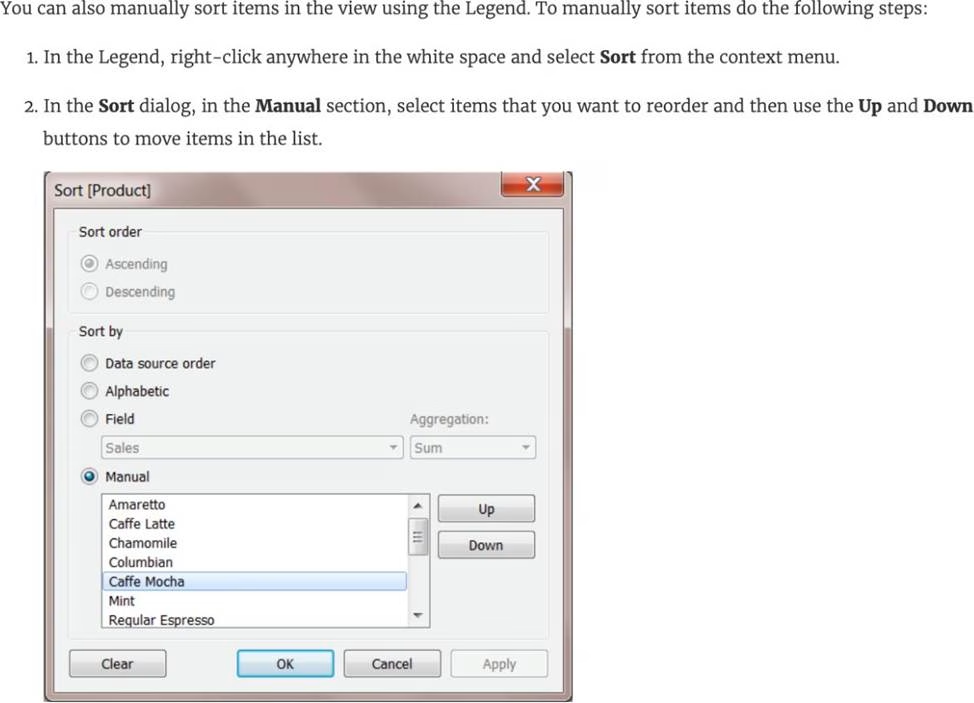
For a ____________ sort, no matter how the data changes, the values will always stay in the sort order we kept stuff in.
- A . Random
- B . Manual
- C . Topological
- D . Hierarchical
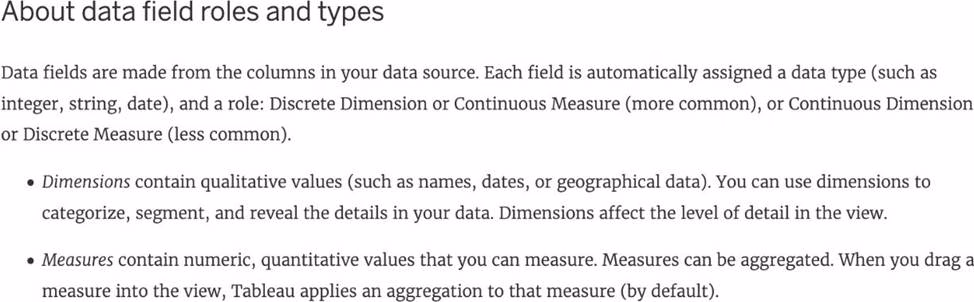
Broadly speaking, after an importing a dataset in Tableau Desktop, all fields in it are broken down into _______________________
- A . Dimensions and Measures
- B . Rows and Columns
- C . Labels and Values
- D . Numbers and Headers
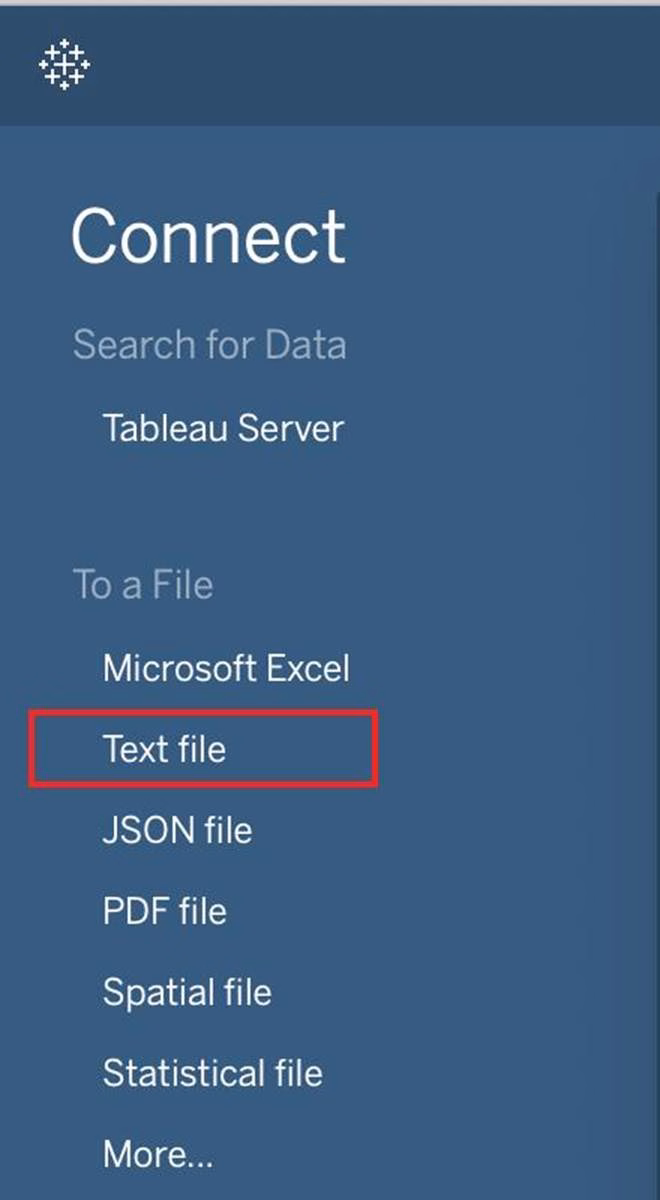
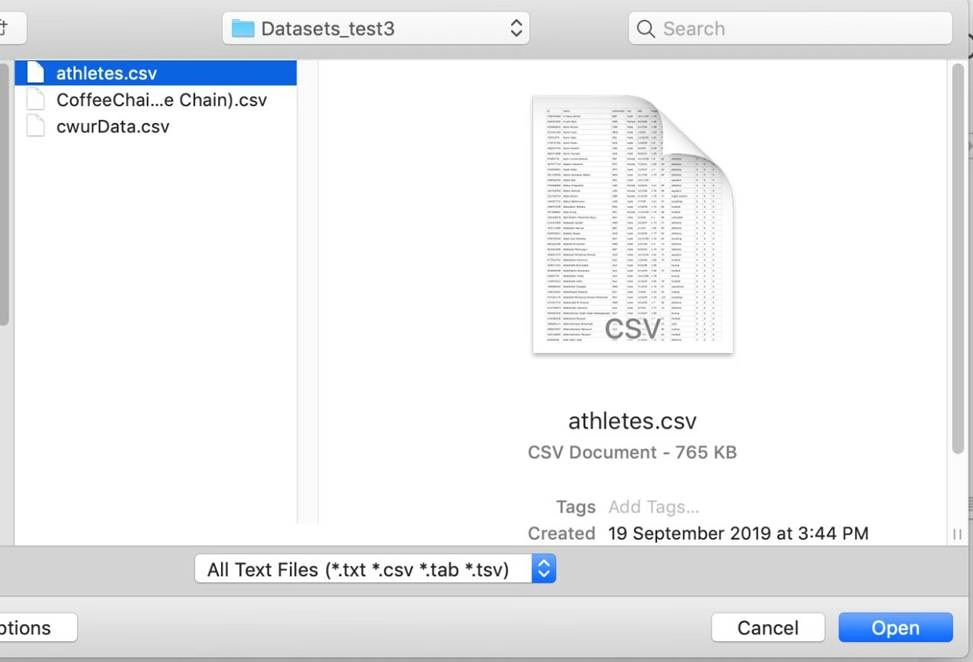
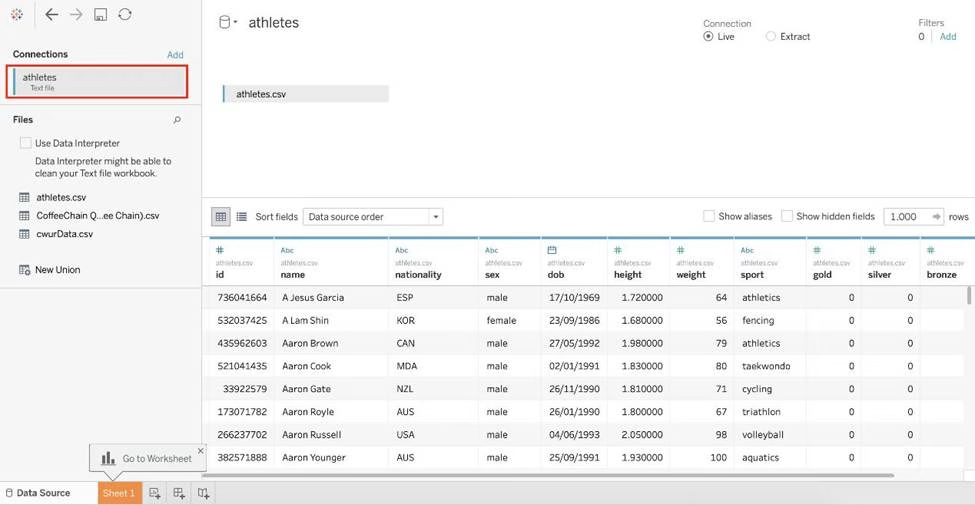
To connect Tableau to a CSV data source what type of connection should you use?
- A . Spatial
- B . Excel
- C . Text
- D . JSON
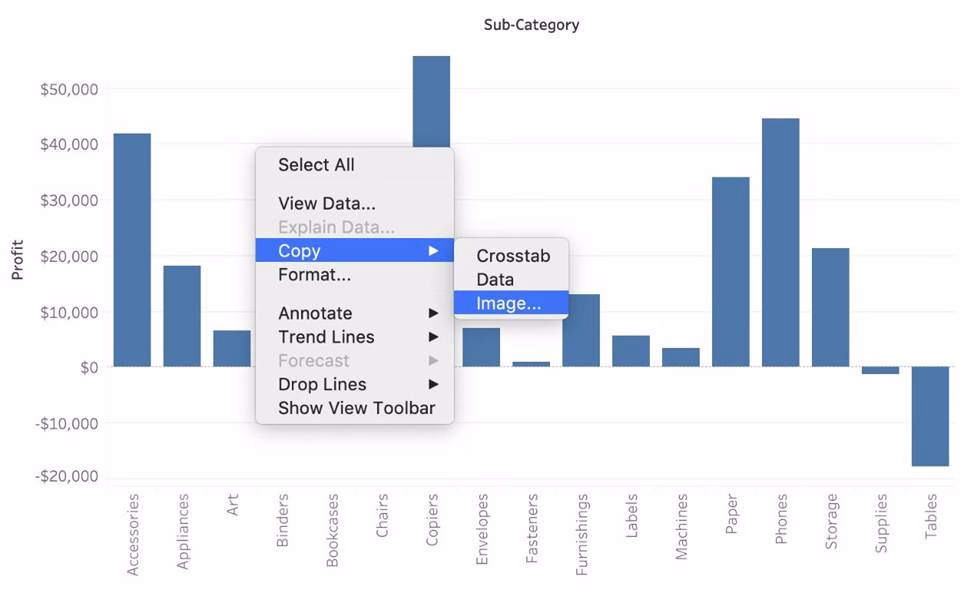
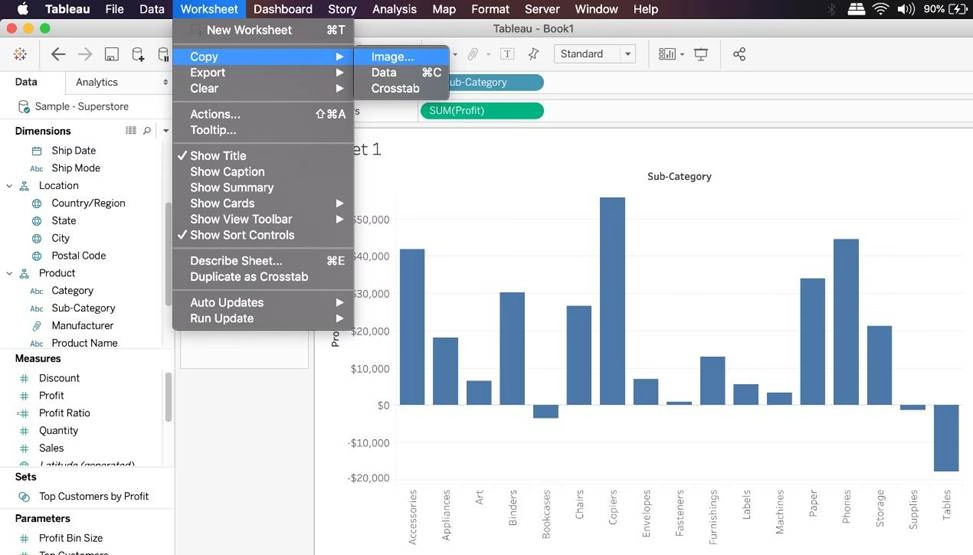
Which of the following are valid ways to copy a worksheet visualisation as an image?
- A . By simply clicking Control + V on the keyboard
- B . By clicking on Worksheet in the Tableau Main Menu above, and choosing Copy->Image
- C . Using the Marks shelf and choosing Copy->Image
- D . By right clicking on the worksheet visualisation and selecting Copy->Image
You want to add Custom shapes to your visualisation.
Where can you add these new shapes?
- A . In Downloads -> My Tableau Repository -> Shapes
- B . In My Computer -> C: -> Tableau -> Shapes
- C . In Program Files -> Tableau -> Shapes
- D . In My Documents -> My Tableau Repository -> Shapes
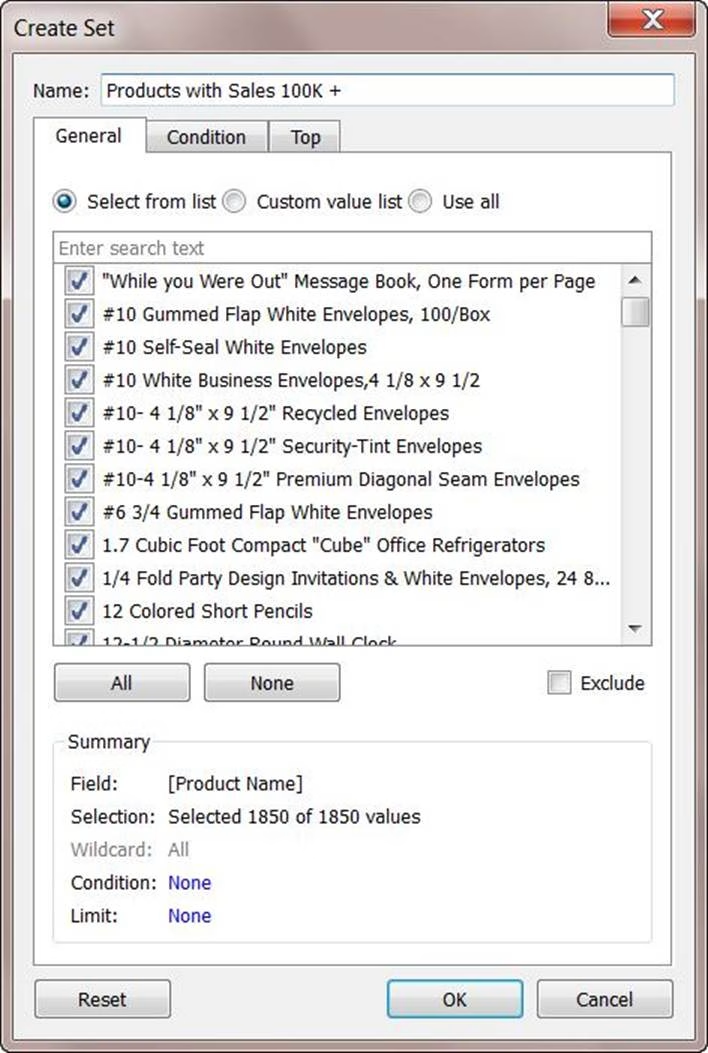
Which of the following is a valid way to create Sets in Tableau?
- A . In the Data pane, right-click a dimension and select Create > Set.
- B . In the Tableau Main Menu, Choose Worksheet and select Create > Set
- C . In the Tableau Main Menu, choose Dashboard and select Create > Set
- D . In the Data pane, right-click a measure and select Create > Set.
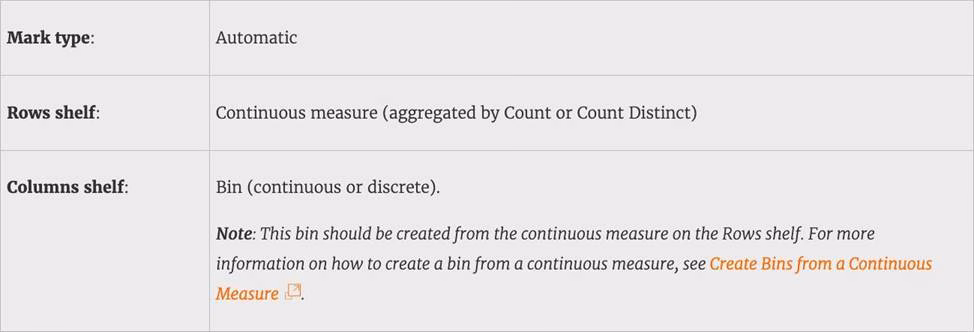
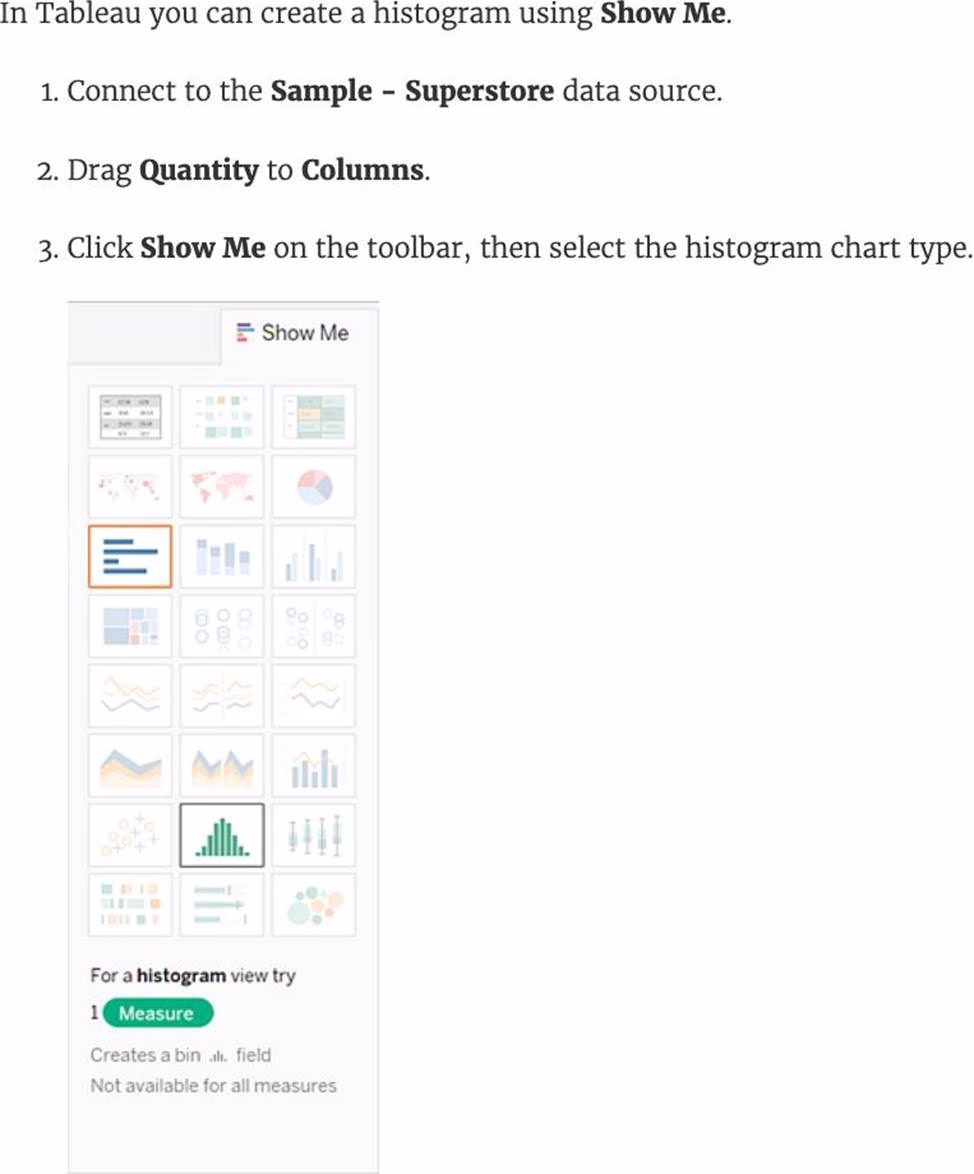
Which of the following can you use to create a Histogram?
- A . 2 measures
- B . 1 measure
- C . 2 dimensions
- D . 1 dimension
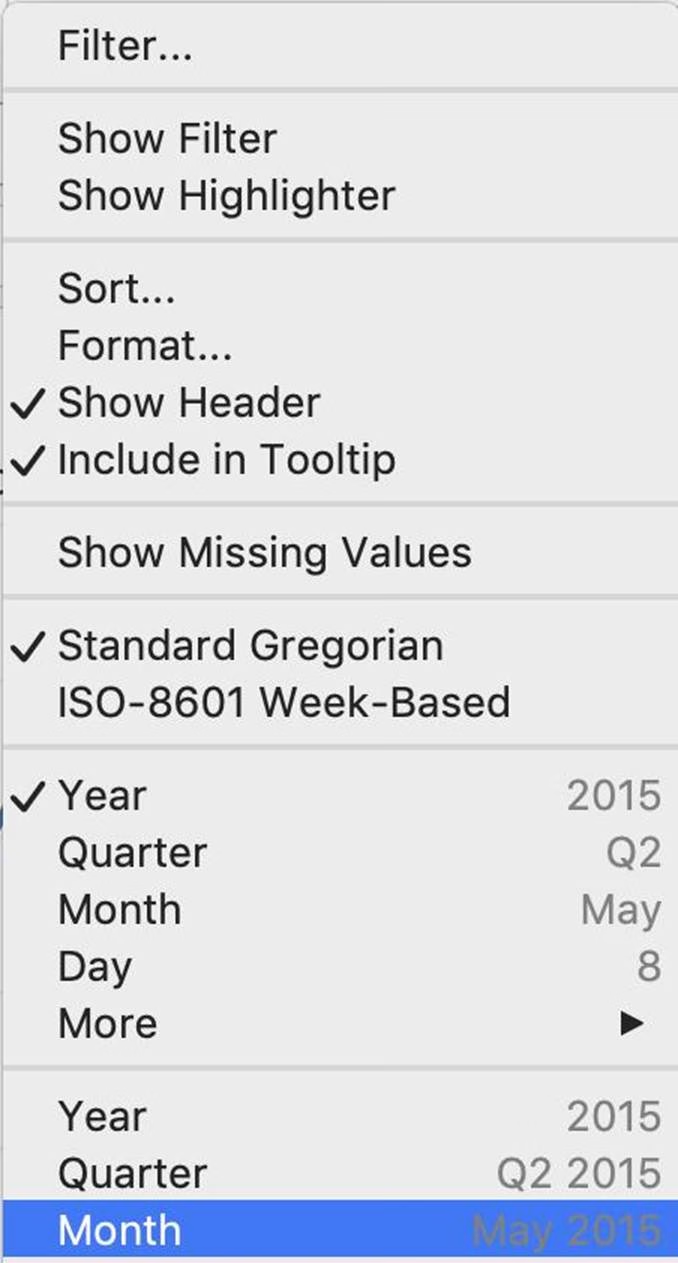
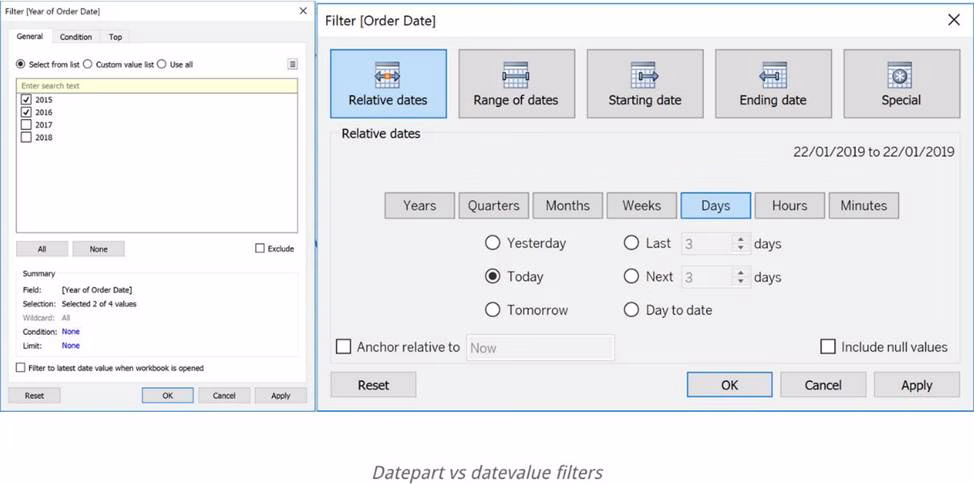
If you see the following Filter, then you’re working with _______________________ Larger image
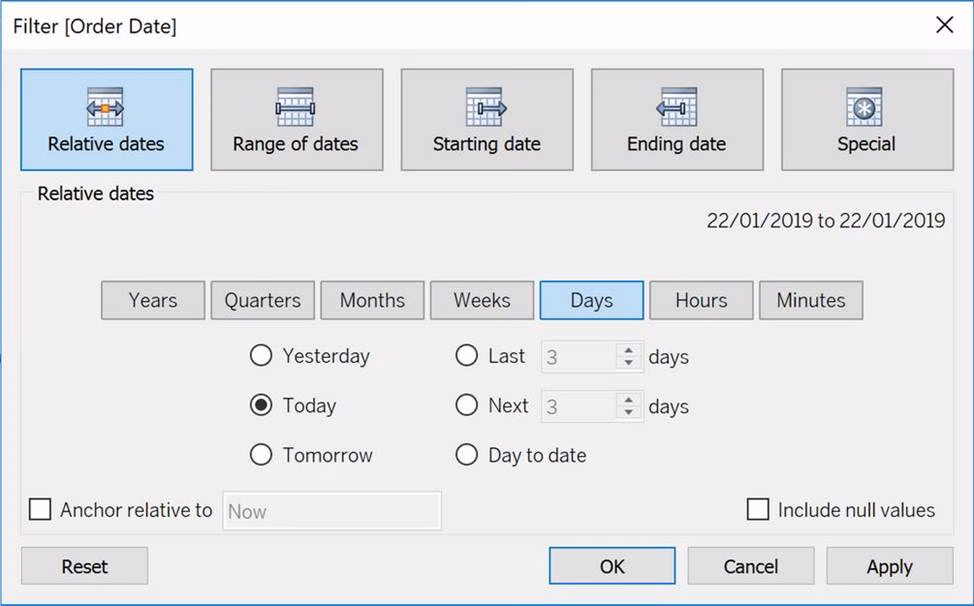
- A . Grouped Dates
- B . Date Functions
- C . Date Parts
- D . Date Values
Latest TDS-C01 Dumps Valid Version with 151 Q&As
Latest And Valid Q&A | Instant Download | Once Fail, Full Refund
