Tableau TDS-C01 Tableau Desktop Specialist Online Training
Tableau TDS-C01 Online Training
The questions for TDS-C01 were last updated at Nov 19,2024.
- Exam Code: TDS-C01
- Exam Name: Tableau Desktop Specialist
- Certification Provider: Tableau
- Latest update: Nov 19,2024
________________ is hosted by Tableau to share our visualisations publically with the world.
- A . Tableau Reader
- B . Tableau Desktop
- C . Tableau Server
- D . Tableau Public
D
Explanation:
Tableau Public is a free service that lets anyone publish interactive data visualizations to the web. Visualizations that have been published to Tableau Public (“vizzes”) can be embedded into web pages and blogs, they can be shared via social media or email, and they can be made available for download to other users. Check it out: https://public.tableau.com/en-us/s/
When creating a dashboard for multiple devices, which of the following Device options are available in the Device Preview section?
- A . Monitor, Default, Phone, Tablet
- B . Phone, Tablet, Laptop, Desktop
- C . Default, Phone, Tablet, Desktop
- D . Phone, Monitor, Laptop, Default
C
Explanation:
The following options are available in the Device preview section when creating a Dashboard:
Graphical user interface
Description automatically generated
Reference: https://help.tableau.com/current/pro/desktop/en-us/dashboards_dsd_create.htm
Which of the following lets you group related dashboard items together so you can quickly position them?
- A . Layout Extensions
- B . Layout Blanks
- C . Layout Containers
- D . Layout positioners
C
Explanation:
Layout containers let you group related dashboard items together so you can quickly position them. As you change the size and placement of items inside a container, other container items automatically adjust
Reference: https://help.tableau.com/current/pro/desktop/en-us/dashboards_organize_floatingandtiled.htm
True or False: A LEFT JOIN or INNER JOIN creates a row each time the join criteria is satisfied, which can result in duplicate rows. One way to avoid this is to use data blending instead.
- A . True
- B . False
A
Explanation:
Joins combine tables by adding more columns of data across similar row structures. This can cause data loss or duplication if tables are at different levels of detail, and joined data sources must be fixed before analysis can begin.
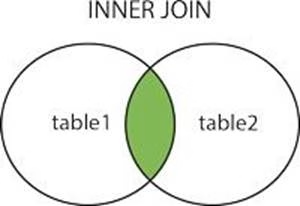
Inner join
Left Join
Blends, unlike relationships or joins, never truly combine the data. Instead, blends query each data source independently, the results are aggregated to the appropriate level, then the results are presented visually together in the view.
Reference: https://help.tableau.com/current/pro/desktop/en-us/multiple_connections.htm
Is SUM a table calculation?
- A . Yes
- B . No
B
Explanation:
SUM is an aggregate function, not a table calculation!
A table calculation is a transformation you apply to the values in a visualization. Table calculations are a special type of calculated field that computes on the local data in Tableau. They are calculated based on what is currently in the visualization and do not consider any measures or dimensions that are filtered out of the visualization.
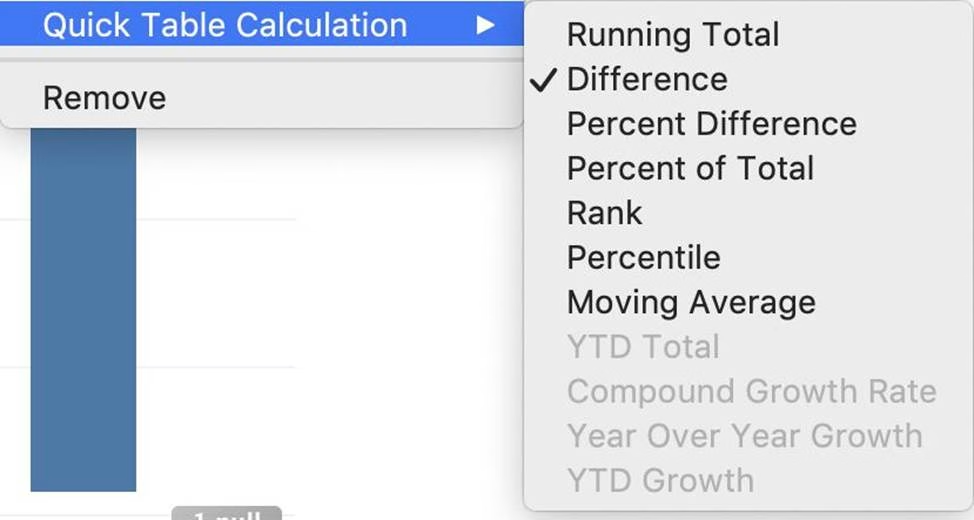
The most common Table calculations are:
Running Total
Percent Difference
Difference
Percent of Total
Rank
Percentile
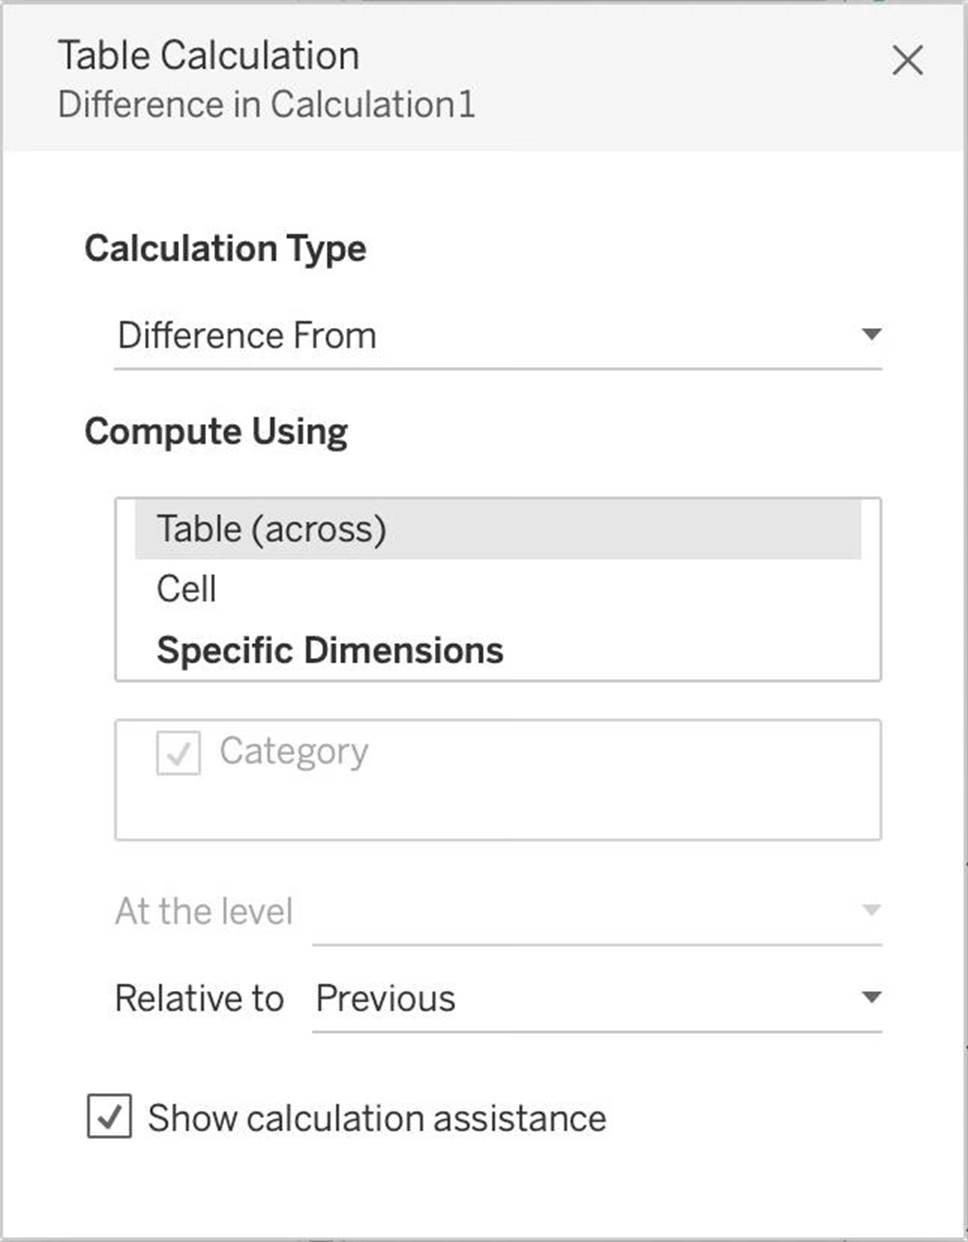
These can be calculated using: Table(across), Cell, or Specific dimensions!
Reference: https://help.tableau.com/current/pro/desktop/en-us/calculations_tablecalculations_definebasic_runningtotal.htm
Which of the following URL prefixes are permitted when creating a URL Action in Tableau?
- A . SMTP
- B . FTP
- C . HTTPS
- D . HTTP
B,C,D
Explanation:
A URL action is a hyperlink that points to a web page, file, or other web-based resource outside of Tableau. You can use URL actions to create an email or link to additional information about your data. To customize links based on your data, you can automatically enter field values as parameters in URLs.
Graphical user interface, text, application
Description automatically generated
Graphical user interface, application, Word
Description automatically generated
Graphical user interface, text, application
Description automatically generated
Graphical user interface, text, application
Description automatically generated
Reference: https://help.tableau.com/current/pro/desktop/en-us/actions_url.htm
Suppose you create a bar chart by dragging a dimension to the Column shelf and a measure to the Rows shelf.
Which of the following would create a stacked bar chart?
- A . By dragging another dimension to the Rows shelf
- B . By dragging another measure to Color on the Marks card
- C . By dragging another dimension to Color on the Marks card
- D . By dragging another measure to the Columns shelf
C
Explanation:
Very important question for the exam and appears quite a lot too.
The correct answer is – By dragging another dimension to Color on the Marks card.
Chart, bar chart
Description automatically generated
This is what the question says we have already created. Now to convert this into a Stacked bar chart, we will drop another dimension on Color in the Marks card.
Chart, bar chart
Description automatically generated
The rest won’t create stacked bar charts, and hence are incorrect choices. The best way to answer such questions on the real exam is to quickly do what the options say and see if they satisfy the requirements in the question.
Using the Time Series table, create a chart that shows the percent difference in Average Inventory on Hand for each Assortment by year and quarter.
How many quarters did the Electronics Assortment show a negative percent difference in the Average Inventory On Hand?
- A . 1
- B . 2
- C . 3
- D . 4
C
Explanation:
If you chose 2, then you were very close but probably didn’t plot the actual Percent Difference on your view. (One of the marks is just over the line).
✑ Firstly, Drop the Week ID onto the column shelf, and convert it to continuous since we need both Year and Quarter as mentioned in the question.
✑ 2) Next, Drop assortment to filters shelf so that we can focus on Electronics!
3) This should be your view now. Click on the Show Mark Labels icon as shown: The final view is as follows, with 3 points below 0 (i.e negative)
Which of the following are interactive elements that can be added to a dashboard for users?
- A . URL Action
- B . Filter Action
- C . Highlight Action
- D . Edit Tooltip Action
A,B,C
Explanation:
We can perform filter, URL and highlight actions out of the above given choices on a dashboard.
Please refer to the image below:
Graphical user interface
Description automatically generated
Reference: https://help.tableau.com/current/pro/desktop/en-us/actions_dashboards.htm
Which of the following are the options to export the data used to build the view / visualisations?
- A . CSV file
- B . PDF File
- C . JSON format
- D . MS Access Database
A,D
Explanation:
You can export the data in a Tableau data source, including all or part of the records from your original data. Alternatively, you can export only the portion of data used to generate the view.
Since the question mentions the data used to build the view, we’ll focus on that:
*Export data in the view to Microsoft Access or .csv*
Export the data that is used to generate the view as an Access database (Windows only) or.csv file (Mac only).
1) In Tableau Desktop, select Worksheet > Export > Data.
2) Select a location and type a name for your Access database or .csv file.
3) Click Save.
4) If you’re on Windows, the Export Data to Access dialog box displays to give you the option to immediately use the new Access database and continue working in Access without interrupting your work flow.
Graphical user interface, text, application, email
Description automatically generated
Reference: https://help.tableau.com/current/pro/desktop/en-us/save_export_data.htm