Tableau TDA-C01 Tableau Certified Data Analyst Exam Online Training
Tableau TDA-C01 Online Training
The questions for TDA-C01 were last updated at Feb 22,2026.
- Exam Code: TDA-C01
- Exam Name: Tableau Certified Data Analyst Exam
- Certification Provider: Tableau
- Latest update: Feb 22,2026
You have a database that includes field named sales, City and Region.
You have the following chart that shows the number of sales made in different cities.
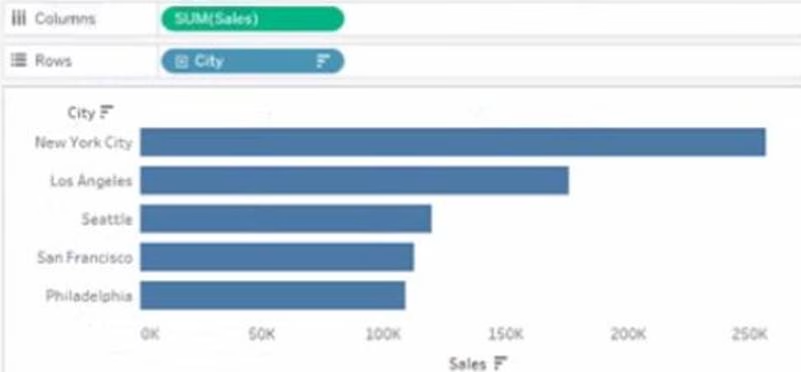
You want to dynamically show the corresponding region when users hover their mouse over any of the bars.
What should you do?
- A . Right-click a in the chat, select Annotate and then select Mark.
- B . Right-click a bar in the chart select Mark Label and then select Always show.
- C . Edit the aliases for City.
- D . Drag Region to Tooltip on the Marks card
You want to connect a Tableau workbook to a dataset in a Microsoft Excel spreadsheet.
What should you do from Tableau Desktop?
- A . From the Data menu select New Data Source
- B . From the Data menu select Replace Data Source
- C . From the File menu select Import Workbook
- D . From the File menu select New
You plan to create a visualization that has a dual axis chart. The dual axis chart will contain a shape chart and a line chart will use the same measure named Population on the axis. You need to configure be shapes to be much larger than the line.
What should you do?
- A . Duplicate Population Drag the duplicate to the second Marks card and configure the see of the marks independently
- B . Create a custom shape that is larger than the default shape and add the shape to the Shapes folder in My Repository
- C . For the second axis select Shape on the Marks card From Select Shape Palette select Custom and then select Reset
- D . Change Population to a discrete dimension
You have a dashboard that contains confidential information about patients health. The data needs to always be up to date tor a team of healthcare workers.
How should you share me dashboard with the healthcare workers?
- A . Publish the dashboard to Tableau Public
- B . Print the dashboard to PDF
- C . Publish aw dashboard to Tableau Server
- D . Export the dashboard as a .twbx
You have the following dataset.
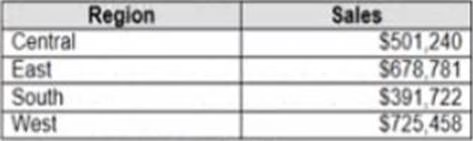
Which Level of Detail (LOD) expression should you use to calculate tie grand total of all the regions?
- A . {FIXED: [Region] SUM Sales}
- B . {FIXED: SUM Sales}
- C . {Fixed: [Region]: TOTAL Sales}
- D . {FIXED: TOTAL (Sales)}
You have the following data source in tableau Server.

You need to ensure that the data is updated every hour.
What should you select?
- A . New
- B . Extract Refreshes
- C . Connected Workbooks
- D . Connections
You have a line chart on a worksheet.
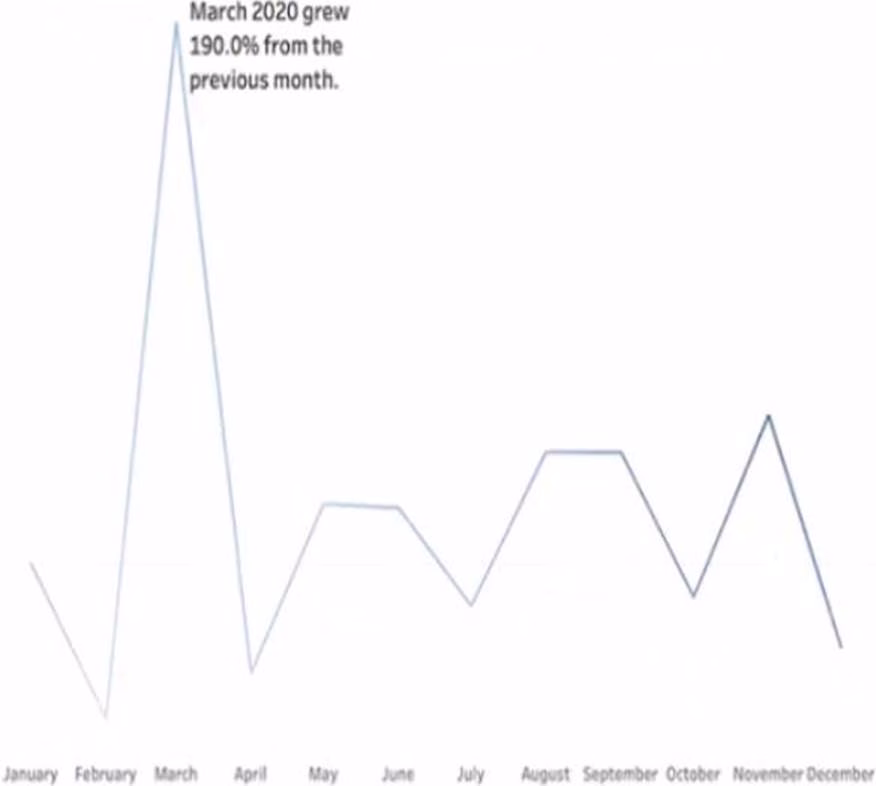
You want to add a comment to March 2020 as shown in the following visualization.
What should you do?
- A . Drag the growth rate to Text on the Marks card
- B . Enable captions
- C . Annotate March 2020
- D . Add a tooltip
You want to add a comment to March 2020 as shown in the following visualization.
You have the following sets in a Tableau workbook
• Top N Customers
• Customers of 2020
• Top N Products
• Sellers of 2020
Which two sets can you combine? Choose two
- A . Sellers of 2020
- B . Customers of 2020
- C . Top N Products
- D . Top N Customers
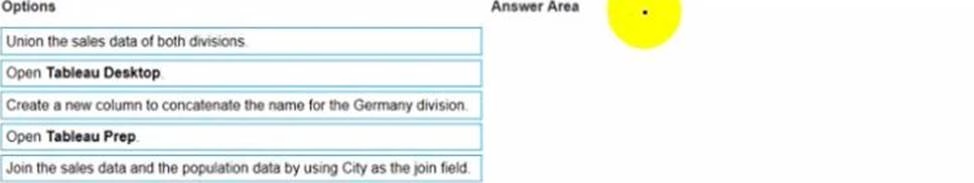
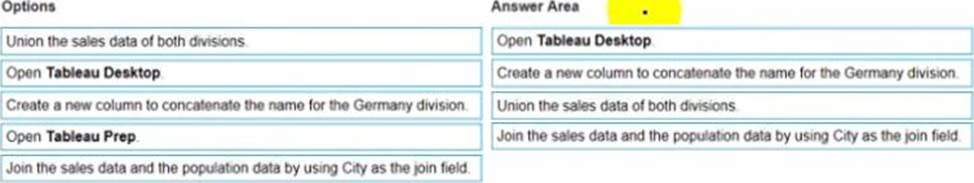
DRAG DROP
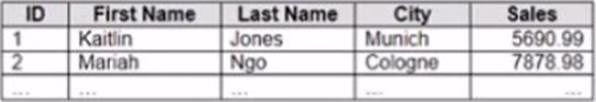
You company has two divisions located in the United States and Germany Bach division has a separate database.
The following is a sample of the sales data for the division in the United States.
The following is a sample of the sales data for me division in Germany.
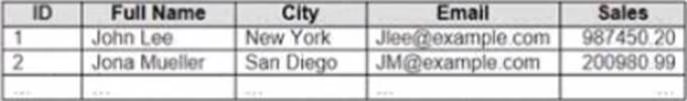
You have population data in a file named Populatio.csv. the following is a sample of the data.
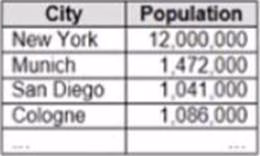
You plan to create a visualization that ml show tie sales per capita for each salesperson Each salesperson must be identified by identified by their full name.
You need to prepare the data to support the planned visualization. The data source must support being published.
Which four actions should you perform in order? (Place the four correct options n order Use the arrows to move Options to Answer Area arrows to re-order the options. Use Answer Area arrows to re-order the options)
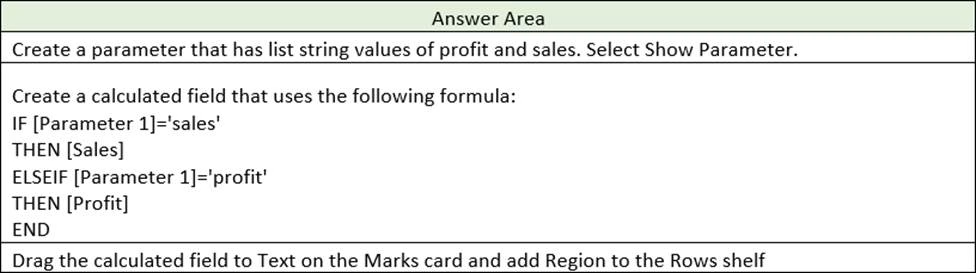
DRAG DROP
You have the following dataset.
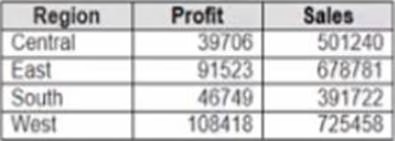
You need to create the following worksheet.
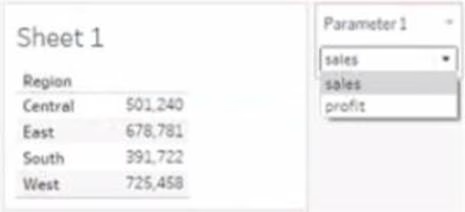
The table must show either profit or sales based on the selection from the Parameter 1 menu.
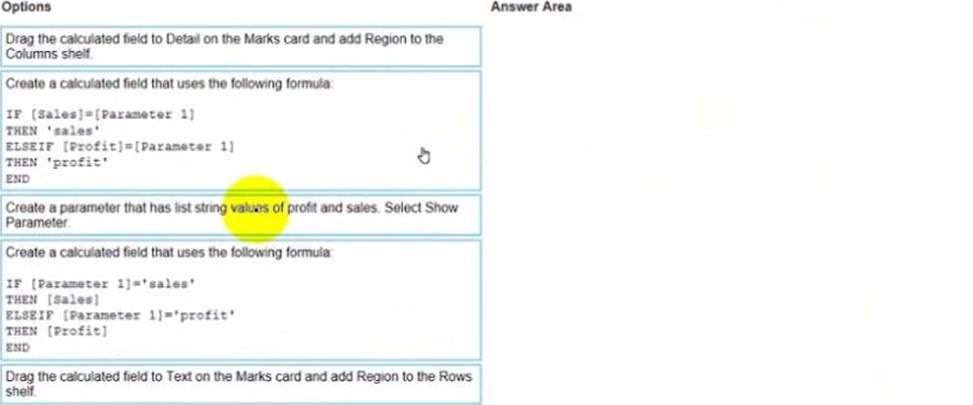
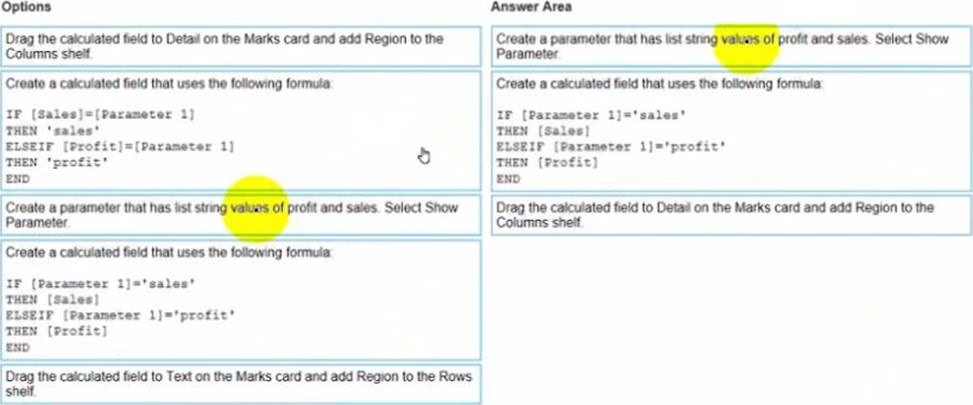
Which three actions should you perform in orders? (Place the three correct options in order Use the arrows to move Options lo Answer Area Use Answer Area arrows to reorder the options)
Latest TDA-C01 Dumps Valid Version with 55 Q&As
Latest And Valid Q&A | Instant Download | Once Fail, Full Refund
