Tableau TDA-C01 Tableau Certified Data Analyst Exam Online Training
Tableau TDA-C01 Online Training
The questions for TDA-C01 were last updated at Apr 05,2025.
- Exam Code: TDA-C01
- Exam Name: Tableau Certified Data Analyst Exam
- Certification Provider: Tableau
- Latest update: Apr 05,2025
You have the following box plot that shows the distribution of average profits made in every state by region.
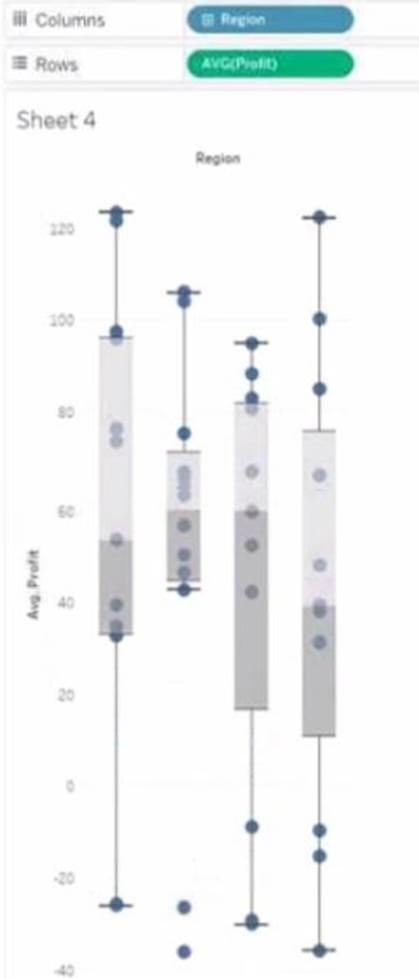
Which region has the smallest distribution of profits?
- A . South
- B . Cast
- C . Central
- D . West
HOTSPOT
You have the following dashboard.
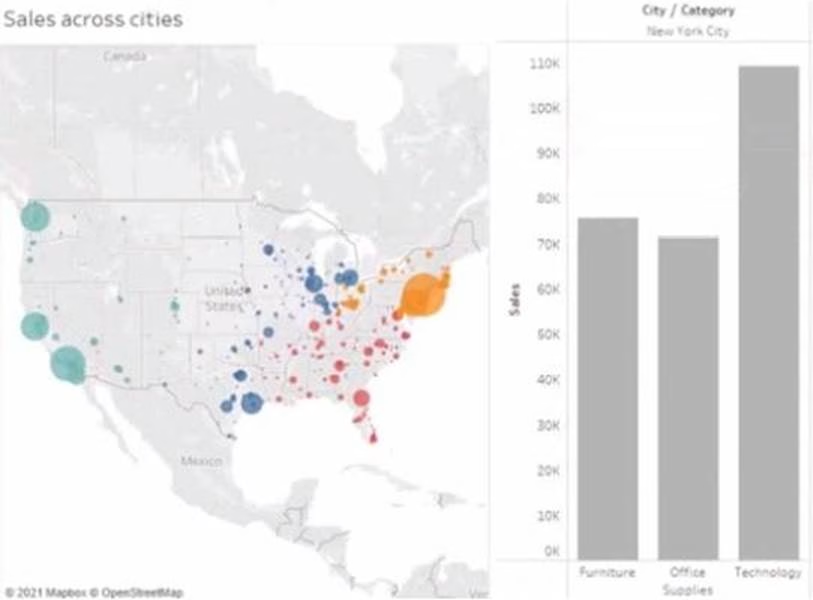
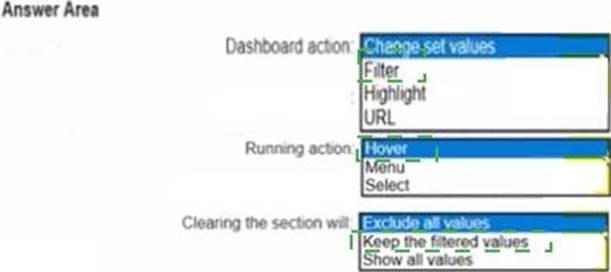
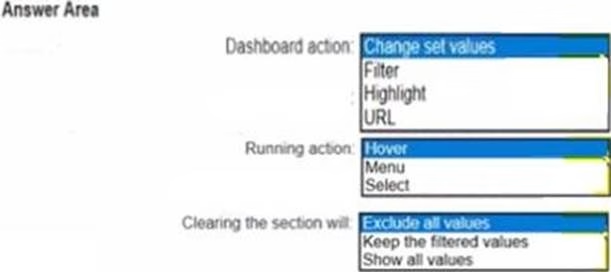
When a user selects a only on the map the data on the bar chart must show only the data for the selected city. The data in the bar chart must change only when the user selects a different city How should you configure the dashboard action? (Use the dropdowns in the Answers Area to select the correct options.)
You have the following dashboard that contains two visualizations.
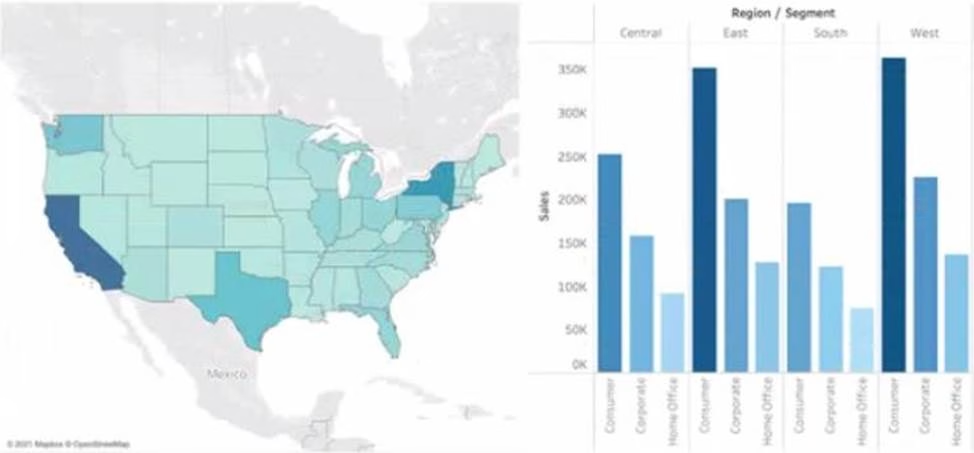
You want to show only visualization at time. Users must be able to switch between visualizations.
What should you me?
- A . A parameter and a calculated filed
- B . Worksheet actions
- C . Showhide buttons
- D . Dashboard actions
You publish a dashboard tut uses an attract. The extract refreshes every Monday at 10:00.
You need to ensure that the extract also refreshes on the last day of the month at 18:00.
What should you do?
- A . From Tableau Desktop, open the Publish Workbook dialog box and configure the schedule.
- B . From Tableau Server select the workbook select Refresh Extracts and then add a new extract refresh
- C . From Tableau Server. select Schedules find the schedule of the extract, and change the frequency to the Last day of the month
- D . From Tableau Server. select Schedules and change the priority of the existing schedule
A colleague provides you with access to a folder that contains the following files:
• Sates.csv
• Bookl.twb
• Sates.hyper
• Export.mdb
Which He contains an extract?
- A . Export mdb
- B . Book1.twb
- C . Sales.hyper
- D . Sales.csv
You have the following tiled dashboard that has one sheet.
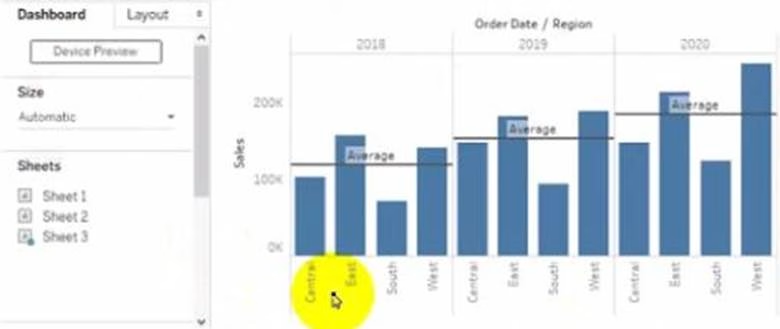
You want to replace fit sheet with Sheet2.
What should you do?
- A . Right-click Sheet2 and select Add to Dashboard.
- B . Select Sheets and click the Swap Sheet button next to Sheet2.
- C . From the context menu of Sheet3. select Remove Dashboard item
- D . Drag Sheet2 to the dashboard.
- E . From the context menu of Sheet3. select Deselect
You have the following line chart that shows the average sales by month.
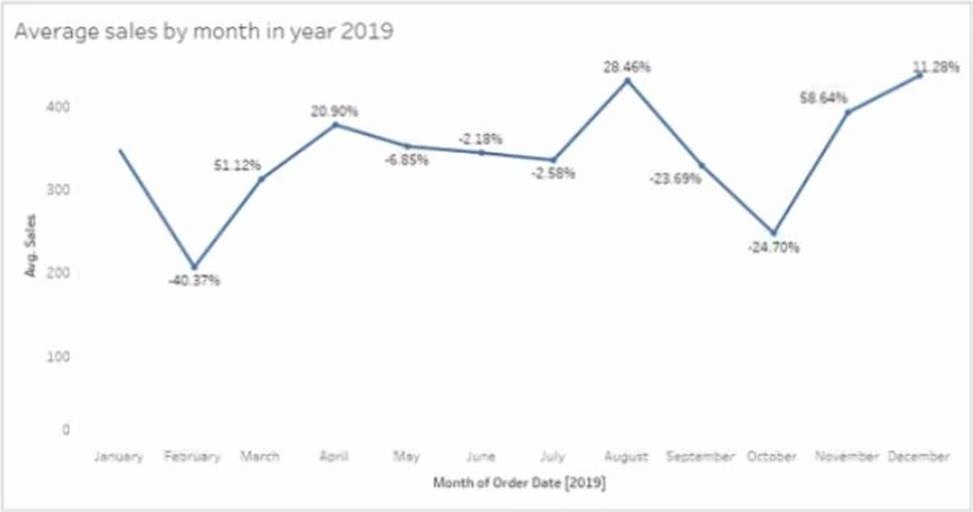
Which month had the biggest increase in swage sales compared to me previous month in 2019?
- A . August
- B . October
- C . December
- D . November
You are the owner of an alert.
You receive an email notification that the alert was suspended
From where can you resume the suspended alert?
- A . The Data Source page of Tableau Desktop
- B . The Notification area of Tableau Prep
- C . The My Content area of Tableau web pages
- D . The Shared with Ma page
HOTSPOT
You have the following dataset.

Yon need to calculate the ranking shown in the Rank field.
How should you complete the formula? (Use the dropdowns in the Answer Area to select the correct options to complete the formula)

You have the Mowing dashboard.
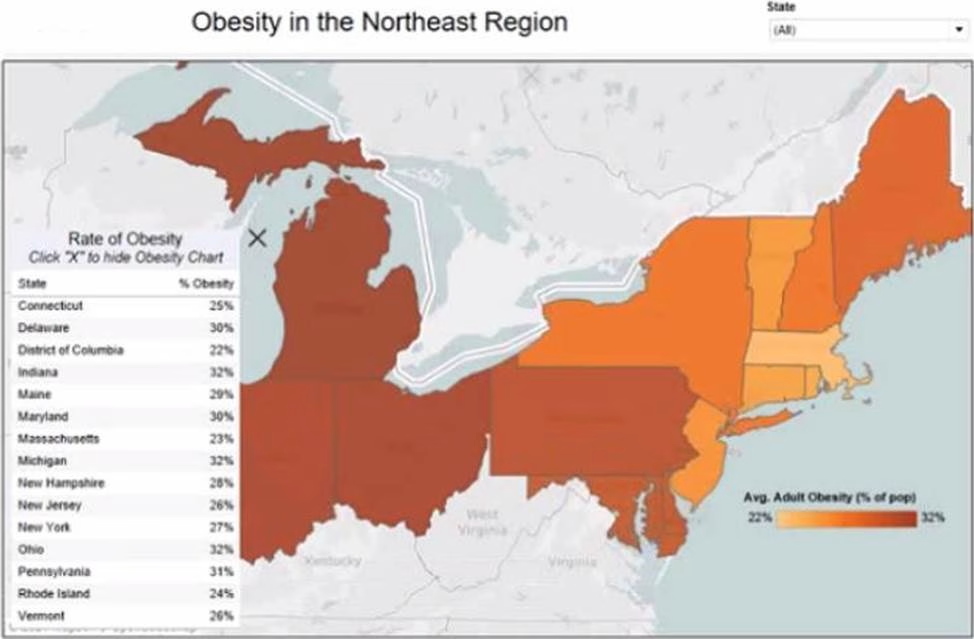
Which two elements are floating? Choose two.
- A . The state filter
- B . The color legend
- C . The map
- D . The Rate of Obesity chart
- E . The little
Latest TDA-C01 Dumps Valid Version with 55 Q&As
Latest And Valid Q&A | Instant Download | Once Fail, Full Refund

