Tableau Desktop Specialist Tableau Desktop Specialist Exam Online Training
Tableau Desktop Specialist Online Training
The questions for Desktop Specialist were last updated at Dec 17,2025.
- Exam Code: Desktop Specialist
- Exam Name: Tableau Desktop Specialist Exam
- Certification Provider: Tableau
- Latest update: Dec 17,2025
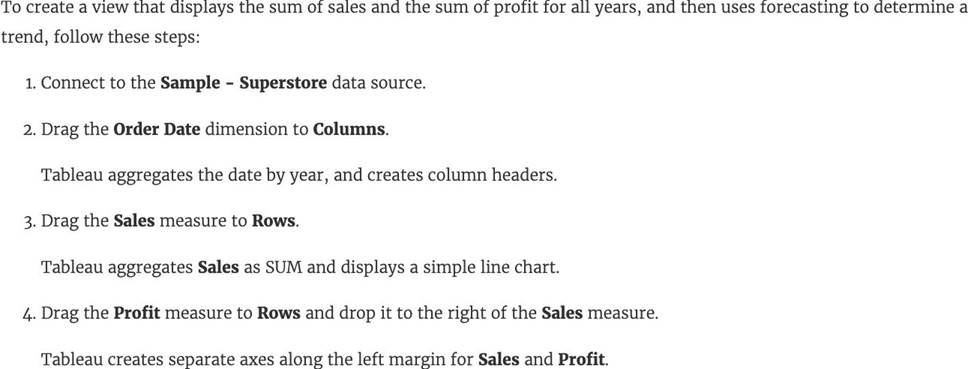
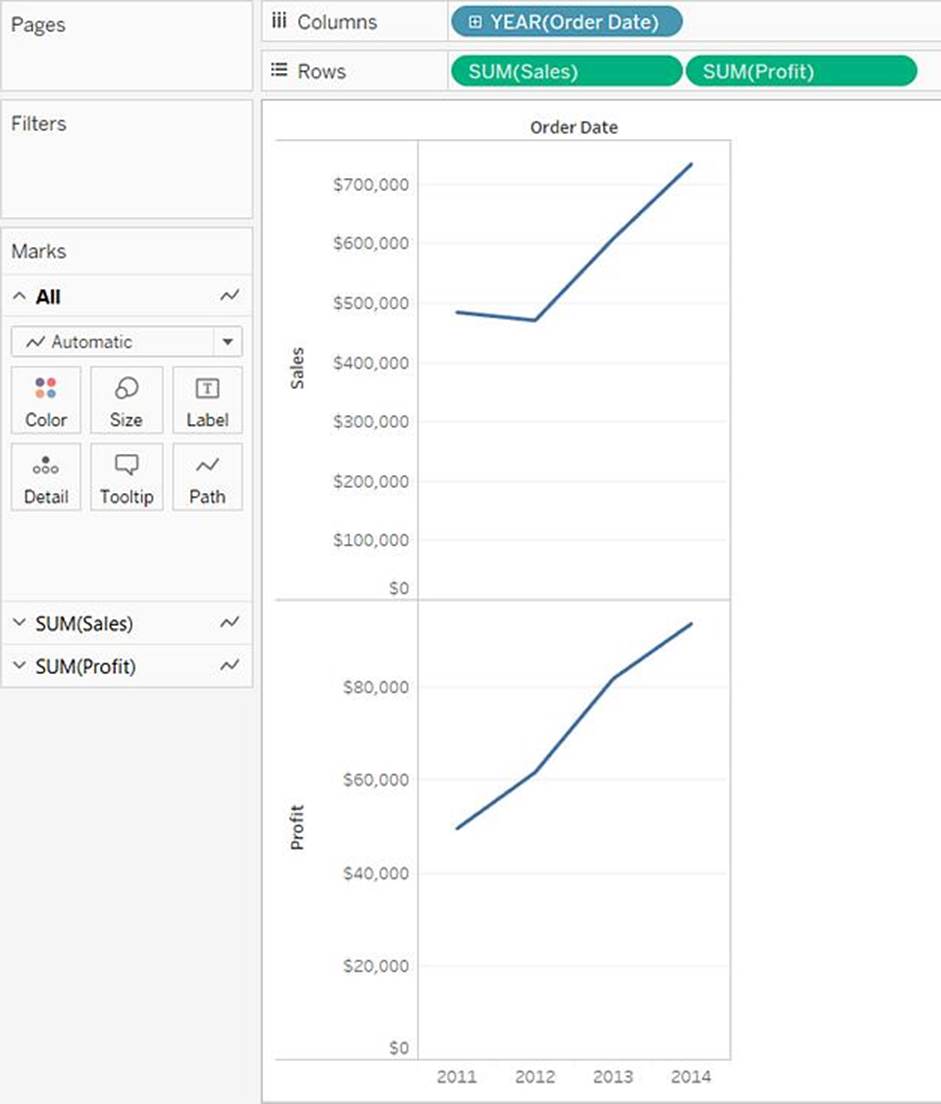
By definition, Tableau displays measures over time as a ____________
- A . Packed Bubble
- B . Bar
- C . Stacked Bar
- D . Line
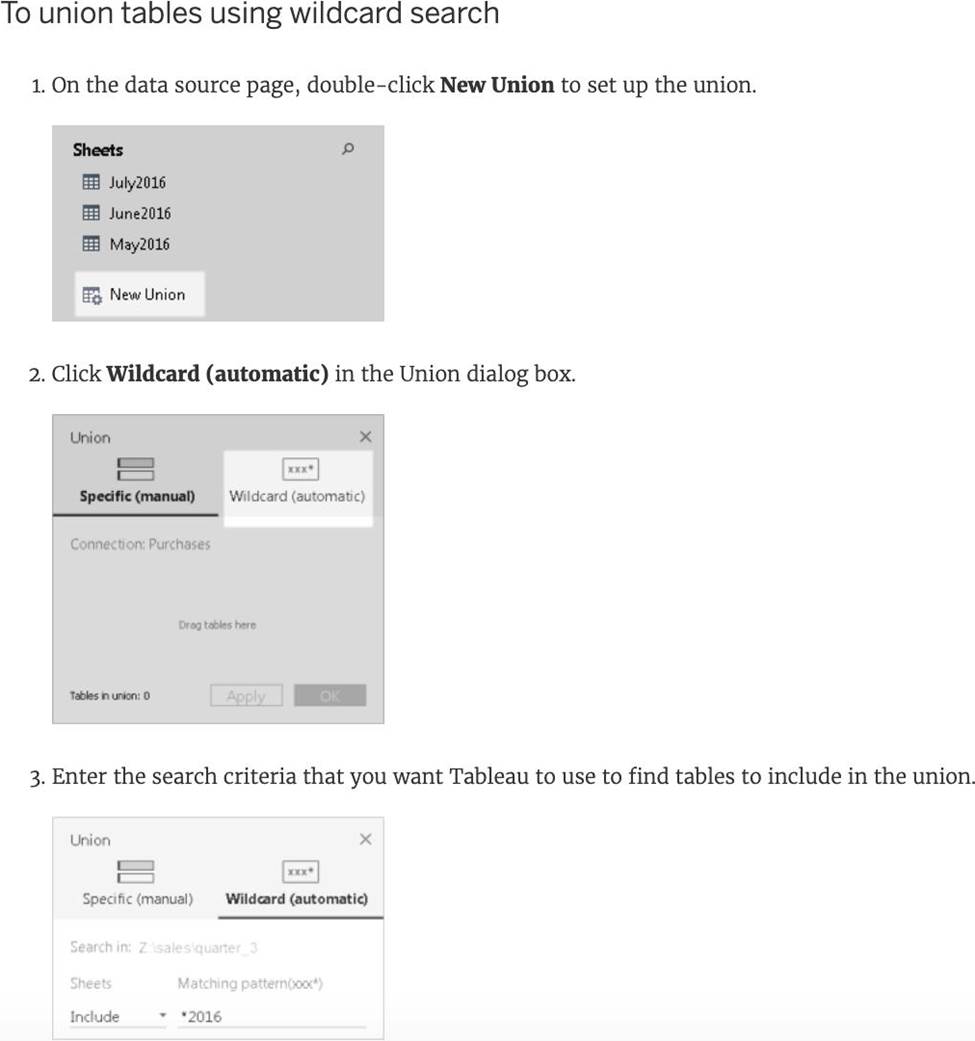
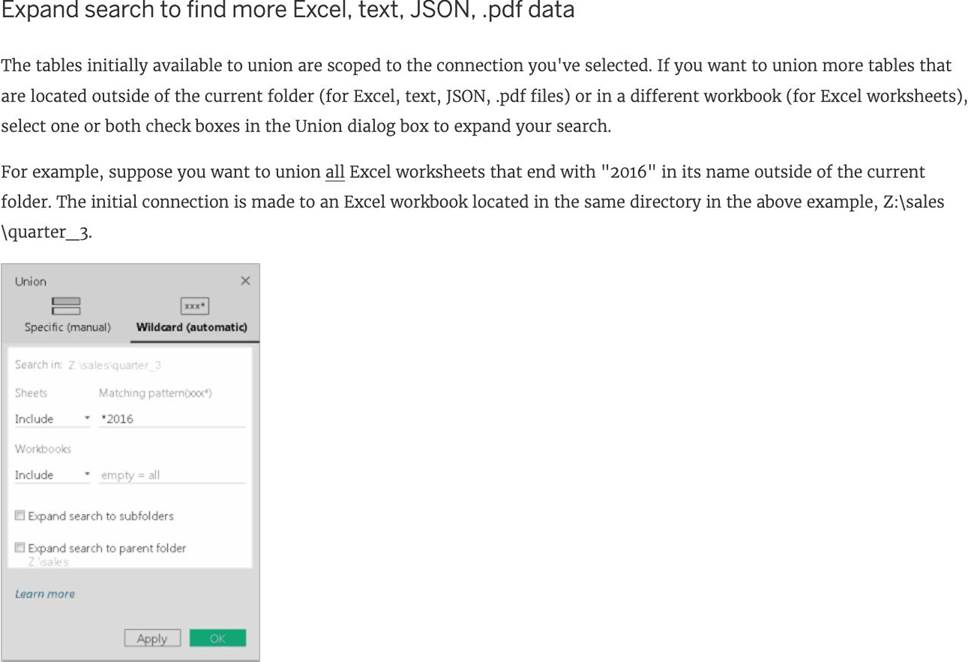
When working with Excel, text file data, JSON file, .pdf file data, you can use _________________ to union files across folders, and worksheets across workbooks. Search is scoped to the selected connection.
- A . Regex Search
- B . Union Search
- C . Pattern Search
- D . Wildcard Search
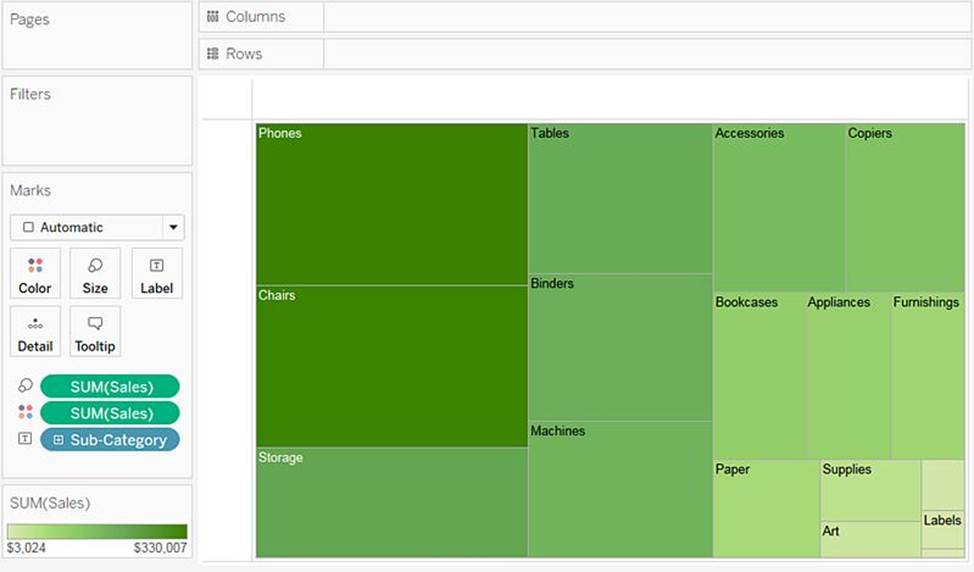
In Tree maps, the size begins with the largest rectangle on the ________________ and the smallest rectangle on the ________________.
- A . top left bottom left
- B . top right, bottom right
- C . top left, bottom right
- D . top right, bottom left
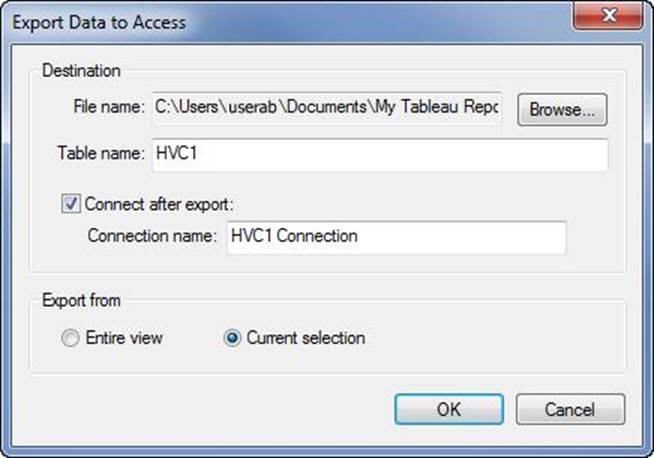
Which of the following are the options to export the data used to build the view / visualisations?
- A . CSV file
- B . PDF File
- C . JSON format
- D . MS Access Database
A field that shows average home values for the United States in 2016 is most likely :
- A . A discrete date part dimension
- B . A continuous date value dimension
- C . A geographical dimension
- D . An aggregated measure
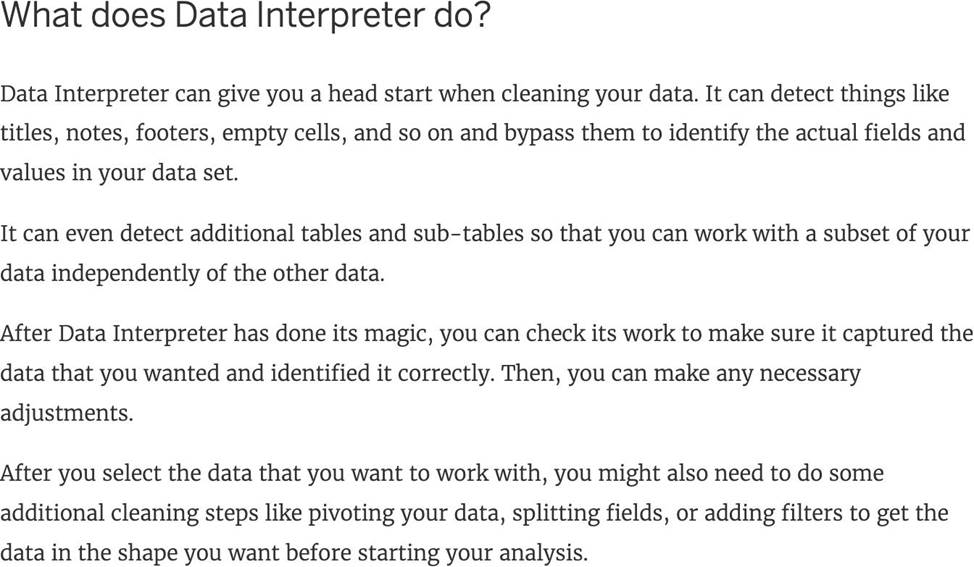
You can use the __________________ in Tableau to clean / organise your data.
- A . Data cleaner
- B . Data manager
- C . Data interpreter
- D . Data organiser
Using the Time-series table, create a cross tab showing the Sales for each Item Number-ID, broken down by Assortments, then add Grand totals to the view.
Which Item Number ID made the maximum sales across all assortments?
- A . 584
- B . 901
- C . Correct)
- D . 205
- E . 660
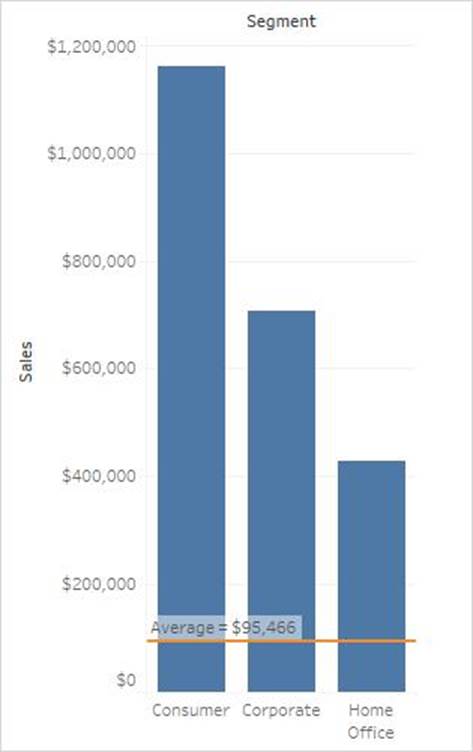
Which of the following can you add a reference line to?
- A . Groups
- B . Calculated Fields
- C . Measures
- D . Dimensions
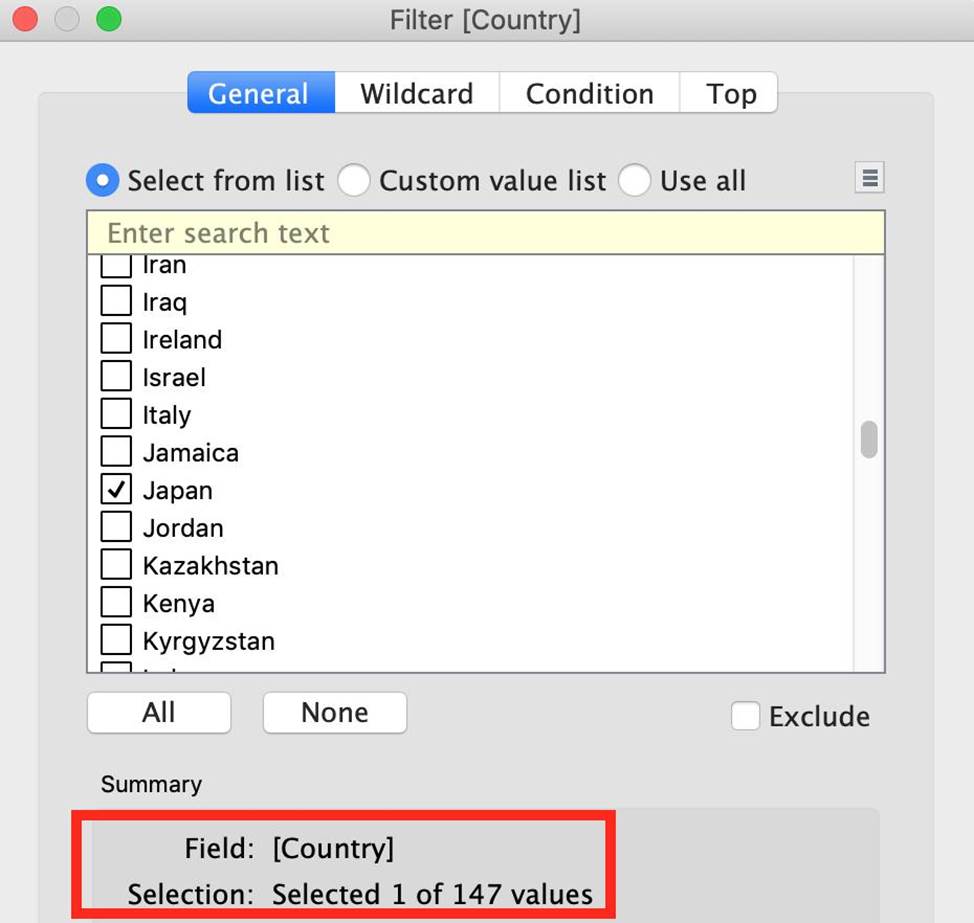
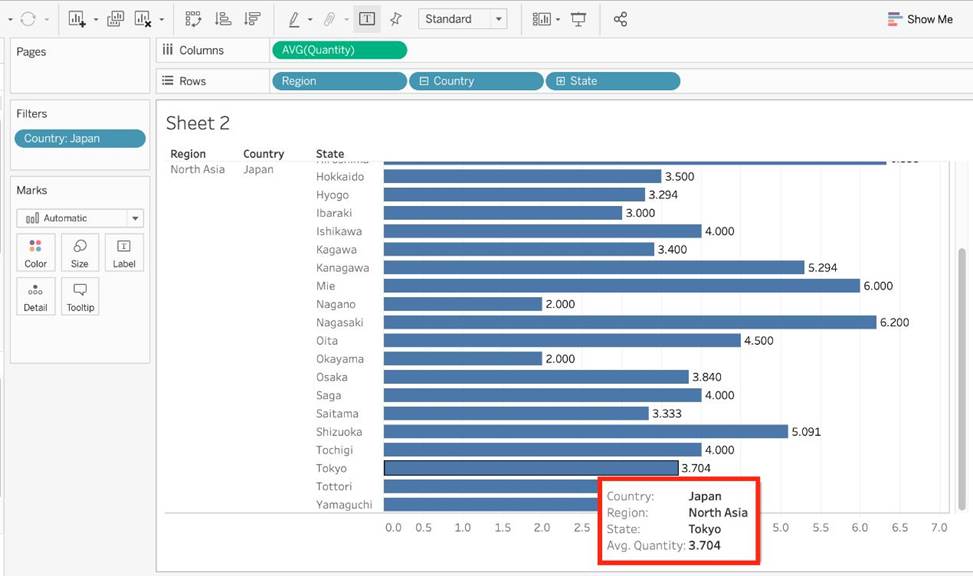
Using the dataset, create a bar chart showing the average Quantity broken down by Region, and filtered by Country to only show Japan.
What was the average Quantity in the State of Tokyo?
- A . 3.000
- B . 3.840
- C . 3.704
- D . 3.500
How would you calculate GDP per capita in Tableau?
- A . SUM([GDP]/[POPULATION])
- B . SUM([Population]/[GDP]])
- C . SUM([GDP]*[POPULATION])
- D . SUM([GDP]) / SUM([Population])
Latest Desktop Specialist Dumps Valid Version with 151 Q&As
Latest And Valid Q&A | Instant Download | Once Fail, Full Refund

