

A report designer can change the data source for a report.
Which statement is true when the new data source is selected?
- A . Data roles do not need to be updated with data items from the new data source.
- B . Data roles for category classifications need to be updated with new data items.
- C . Data roles for control objects need to be updated with new data items.
- D . Data roles for data items that do not have the same name and classification need to be updated.
Refer to the two exhibits:

What option was added to the bubble plot in Exhibit B?
- A . Style: Background Style
- B . Graph Frame: Data tip font
- C . Style: Fill was changed to solid
- D . Graph Frame: Data tip style
Which option CANNOT be added to a scatter plot or heat map?
- A . Linear
- B . Quadratic
- C . Cubic
- D . Exponential
Refer to the Exhibit below:
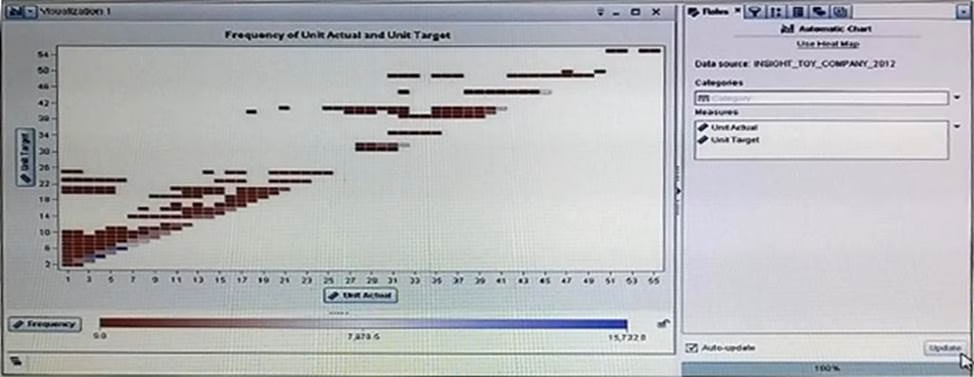

- A . The data item has few unique items
- B . The Heat map visualization was selected on the tool bar
- C . Use Heat map was selected on the roles tab
- D . The data item has high cardinality.
A report designer needs to take a value from a control object and use it in a calculated item.
Which component should the designer use?
- A . A parameter
- B . An action
- C . A custom expression
- D . An object link
Refer to the exhibits:
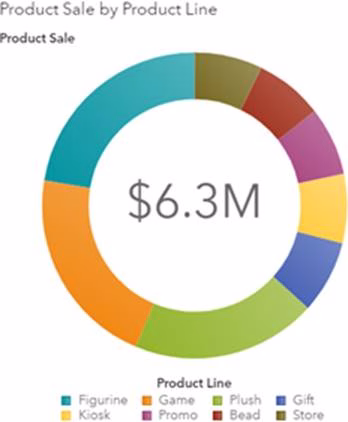

Which option has been added to change the pie chart from Exhibit A to Exhibit B?
- A . Title: Custom Title
- B . Direction: Counterclockwise
- C . Data label location: Arrows
- D . Data label location: Callout
Which statement is true about setting a title for report objects in SAS Visual Analytics Designer?
- A . Titles can only be set for report sections, not for individual report objects
- B . Titles must include the name of the report object
- C . if a title is entered, you can change the format and style of the title.
- D . The tile of a report object is only visible if the user selects the report object
What happens when a report page is duplicated?
- A . All objects, interactions, and page prompts are duplicated.
- B . All page prompts are moved to the report prompt area.
- C . The duplicated page is converted to a hidden page.
- D . Interactions used in the page are NOT duplicated.
A content developer has created an exploration in SAS visual Analytics Explorer with a large number of visualizations.
How can the developer manipulate the display of the visualizations.
- A . Minimize visualizations to the dock pane
- B . Mark visualizations as hidden from the properties tab
- C . Change the size of the visualizations from the view menu
- D . Overlap the visualizations with precision layout.
See the Exhibit below to refer to two Scatter Plot objects created in SAS Visual Analytics. Both objects are using the same data source and have identical data item role assignments.
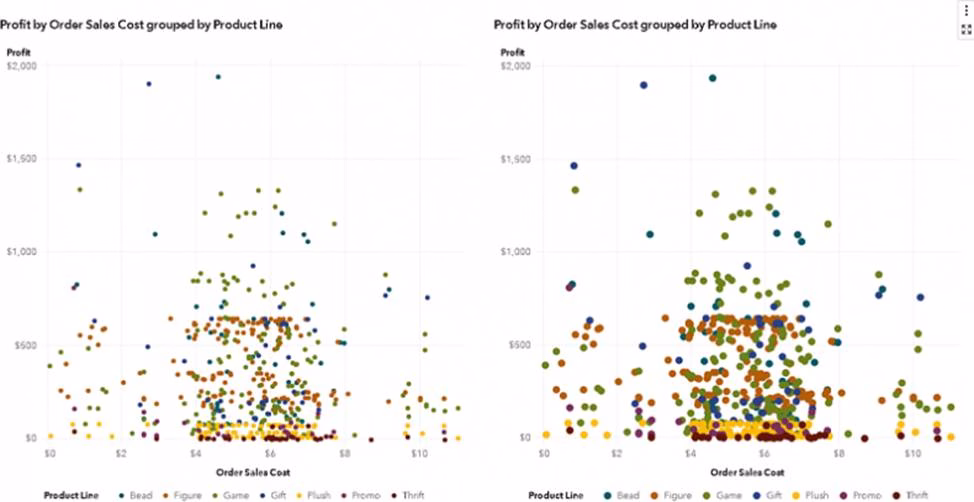

What is different between the two objects?
- A . The Transparency property is set differently on the two objects.
- B . The Marker size property is set differently on the two objects.
- C . A filter is set to show more data points on one of the objects.
- D . The Bin Count property has been decreased on one of the objects.
When sorting a list table object, which statement is TRUE?
- A . List tables CAN be sorted by multiple hierarchies.
- B . List tables CAN be sorted by multiple columns.
- C . List tables CANNOT be sorted by a custom category.
- D . List tables are automatically sorted in descending order by the first column.
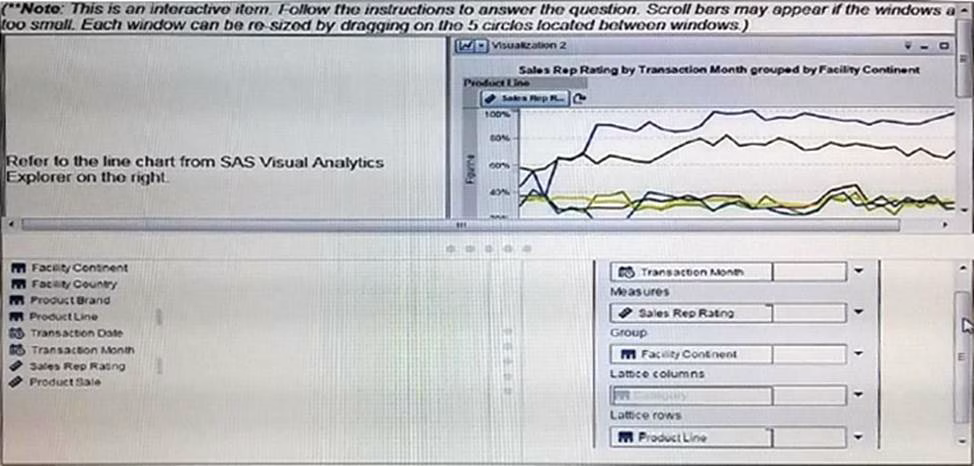
Refer to the exhibit shown:
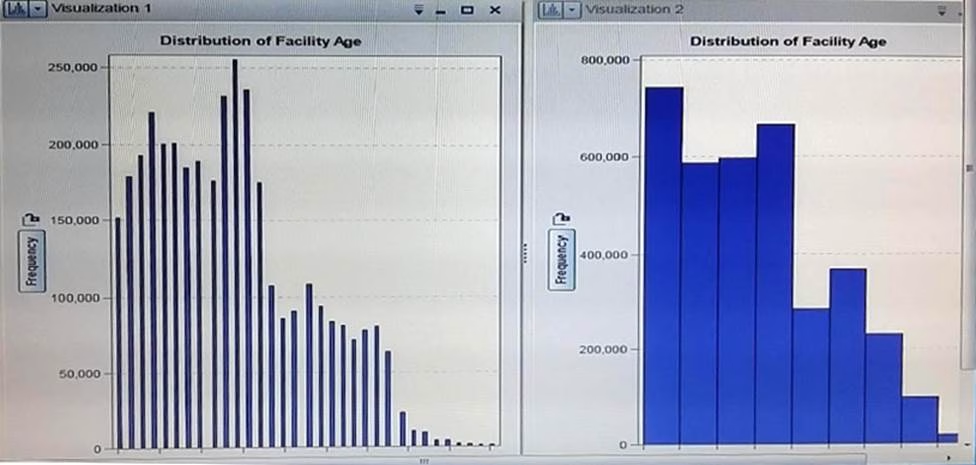

Two vertical bar charts are shown, first thin lines and the next thick bars.
Which method does the content developer use to change visualization1 to visualization 2.
- A . Change the scale on the Y axis
- B . reduce the number of bins
- C . Remove data source filter
- D . Edit the measure Facility Age to have only one decimal point.
A report designer configures a list control to filter another list control using two-way automatic actions.
The designer should add the two list controls to which area of the report?
- A . Report controls
- B . Report canvas
- C . Page properties
Which statement is TRUE about the Image object?
- A . Scale for the image cannot be adjusted.
- B . Links cannot be added to images.
- C . Images can be loaded from a URL.
- D . An image can be placed in the Report prompt area.
Refer the exhibit below:

What is the minimum number of report objects required to create this report in SAS Visual Analytics Designer.
- A . 5
- B . 4
- C . 3
- D . 6
Which action will cause a list table object to display rows of detail data instead of aggregated data?
- A . Add a new display rule and select Detail Rows for the Applies to value.
- B . Select Detail data in the Options pane.
- C . Include a hierarchy data item in the table and expand the hierarchy to the lowest level.
- D . Include only data items that have an aggregation of ‘None’.
A content developer is working in SAS Visual Analytics Explorer currently the data pane only displays some of the data items in the data source.
Why are some of the data items not displayed?
- A . The content Developer used the Show or Hide Items Window.
- B . The Content Developer added a filter to the Visualization.
- C . The content Developer added a data source filter to the Data source.
- D . The content Developer Grouped the data items by data type.
In SAS Visual Analytics Explorer, which feature explores underlying Factors by specifying Target Values for the Forecast Measure?
- A . Scenario Analysis
- B . Goal Seeking
- C . Forecast targeting
- D . Goal Analysis
Which statements pertaining to multiple data sources in a report are TRUE? (Choose two.)
- A . Each object on a page can use data items from one data source or the other in their roles.
- B . A report prompt can be applied to different data sources if the prompted data item can be mapped between the data sources.
- C . A data filter can use data items from both data sources.
- D . Cardinality thresholds for a report limit the number of rows processed in each of the data sources.
Refer to the exhibit below from SAS Visual Analytics Designer.
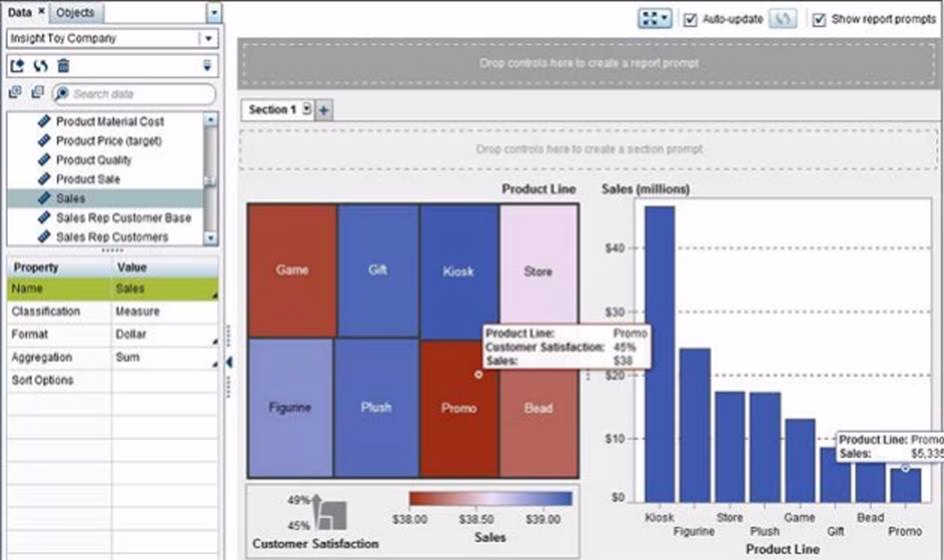

Why is the value for Sales lower in the treemap than in the bar chart?
- A . The aggregation for Sales was changed in the treemap.
- B . A rank was established on the treemap to only show the top eight values.
- C . A data source filter was applied to the treemap.
- D . The measure in the treemap is Sales and the measure in the bar chart is Sales (millions).
In SAS Visual Analytics Designer, which statement is not true about text objects?
- A . Text objects enable you to define section links
- B . Text objects enable you to define report links
- C . Text objects enable you to define Exploration links
- D . Text objects enable you to define info window links
Refer to the exhibit:
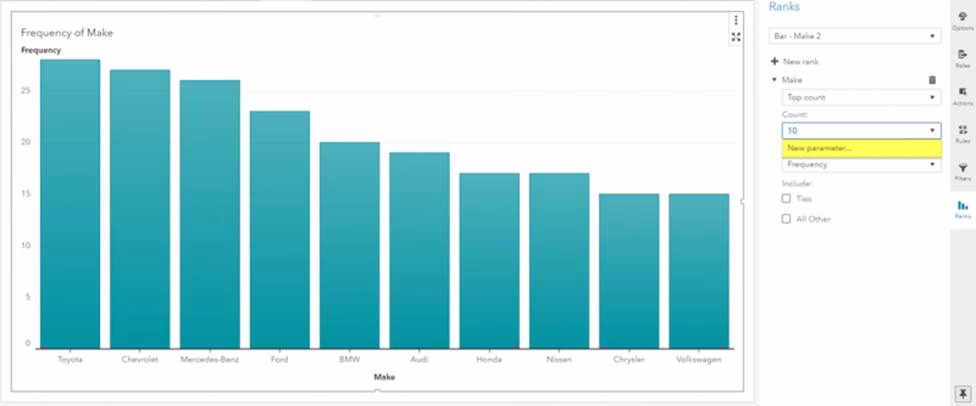

The bar chart object has a rank based on the top ten car makes by Frequency.
What is the effect of selecting the New parameter option from the Count menu?
- A . The value of the parameter will update the number of bars shown in the bar chart.
- B . A filter will be created using the value of the parameter to subset the number of bars shown in the bar chart.
- C . The parameter will allow you to change the By group from Frequency to another measure.
- D . The parameter will allow you to change Top Count to either Bottom Count, Top Percent, or Bottom Percent.
For a cross tab report object created in SAS Visual Analytics Designer, which statement is true?
- A . If a hierarchy data item is assigned to the rows role, no other data items may be assigned to the rows role.
- B . A geography data item that has custom latitude and longitude specified may be added to row data items.
- C . Filters may be applied to both row and column data items, but ranks can only be applied to row data items.
- D . Ascending and descending sorting may be used with both row and column data items but a custom sort can only be used with row data items.
In SAS Visual Analytics Designer, the crosstab report object supports which feature?
- A . scenario analysis
- B . Create Hierarchy
- C . Goal Seeking
- D . Add Sparkline
When working with the text topics object, what must the report designer set in order to use it in a report?
- A . Category
- B . Measure
- C . Sentiment collection
- D . Unique row identifier
Which statement is TRUE when importing an Excel file with multiple worksheets into SAS Visual Analytics?
- A . All selected worksheets are imported and concatenated.
- B . You CAN choose the worksheet to be imported.
- C . You CANNOT import Excel files with multiple worksheets.
- D . All selected worksheets are imported and joined.
Refer to the bar chart from SAS Visual Analytics Designer.
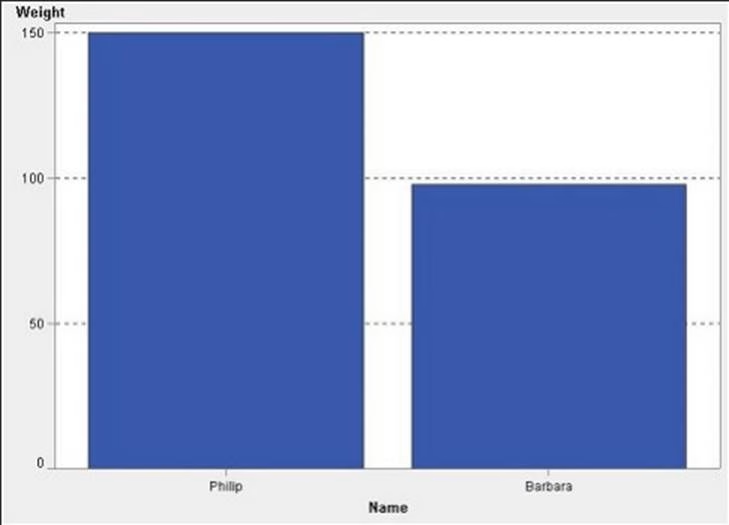

Philip is 16 years old. Barbara is 13 years old.
What happens to the graph above if the content developer creates a Display Rule to set the graph to red if "Age > 14"?
- A . The Philip bar would turn red.
- B . None of the bars change.
- C . On the graph only the Philip bar displays.
- D . Age replaces the Weight measure.
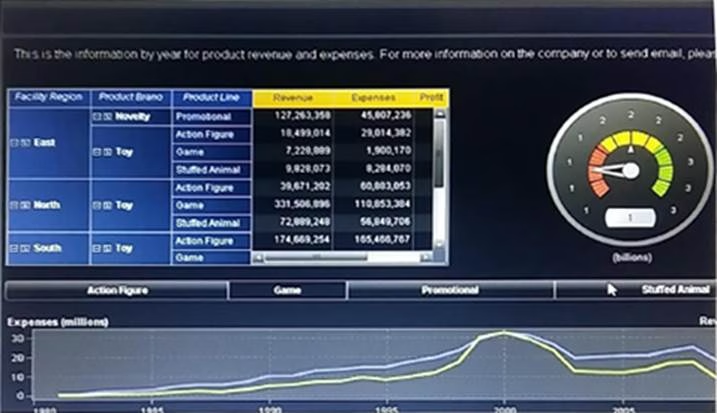
Refer the exhibit below:
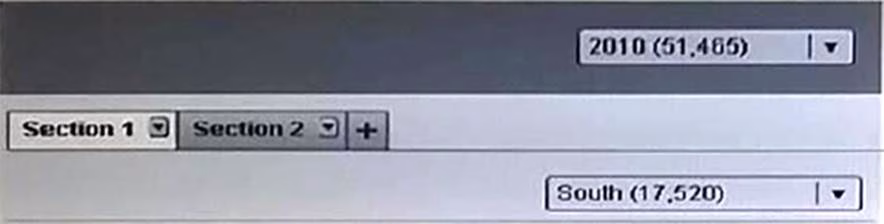

A content developer creates the above report in SAS Visual Analytics Designer. The report contains a report prompt, where year is set to 2010, and a section prompt on section 1 where region is set to south.
How will this report be filtered based on these prompt values?
- A . Section1 will be filtered for region=south. section 2 will be filtered for year=2010
- B . Section1 and section 2 will be filtered for region=south and for year=2010
- C . Section1 will be filtered for Year=2010 and region=south. section 2 will be filtered for year=2010
- D . Section1 will be filtered for Year=2010 and region=south. section 2 will not be filtered.
How is a link created from a chart to a SAS stored process in SAS Visual Analytics Designer?
- A . Select the link to stored process button on the charts properties tab
- B . Select insert > other > stored process link from the main menu
- C . Select the link to stored process button on the create external Link dialog
- D . Drag and drop the stored process report object onto the chart.
Refer to the exhibit:
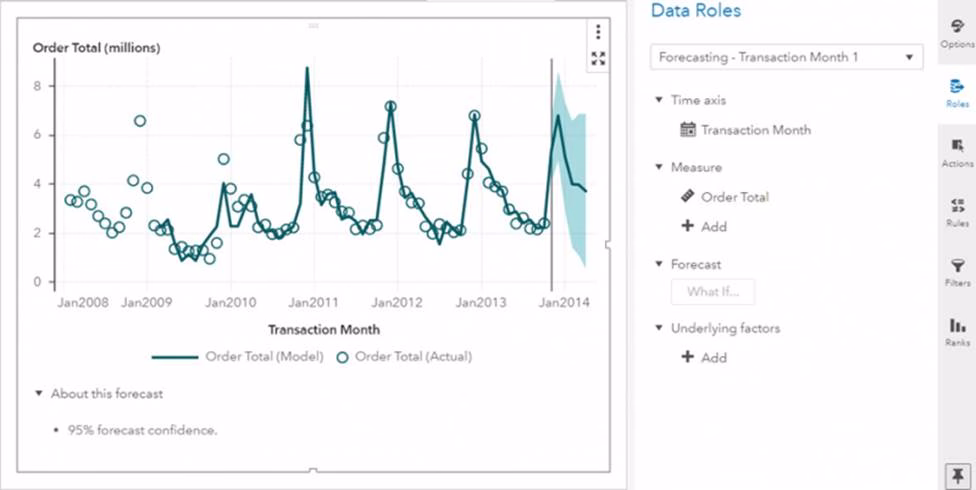

The chart has been filtered to display Year > 2007. The forecast confidence is 95%.
What must you do if you want to enable the What If button in the Roles pane?
- A . Add underlying factors
- B . Expand the forecast horizon
- C . Remove the filter
- D . Increase the forecast confidence
Refer to the exhibit:
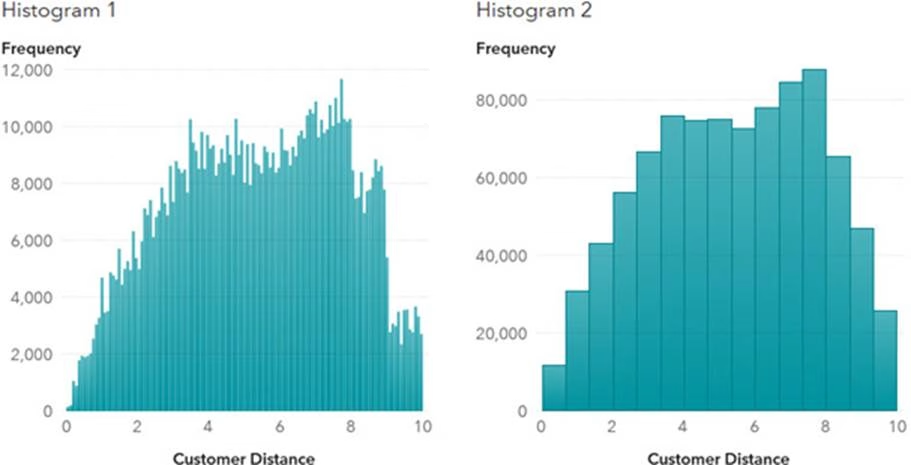

Which method does the report designer use to change Histogram 1 to Histogram 2?
- A . Change the aggregation to minimum.
- B . Remove the data source filter.
- C . Reduce the number of bins.
- D . Change the scale on the Y-axis.
Refer the exhibit below, USA Map shown:
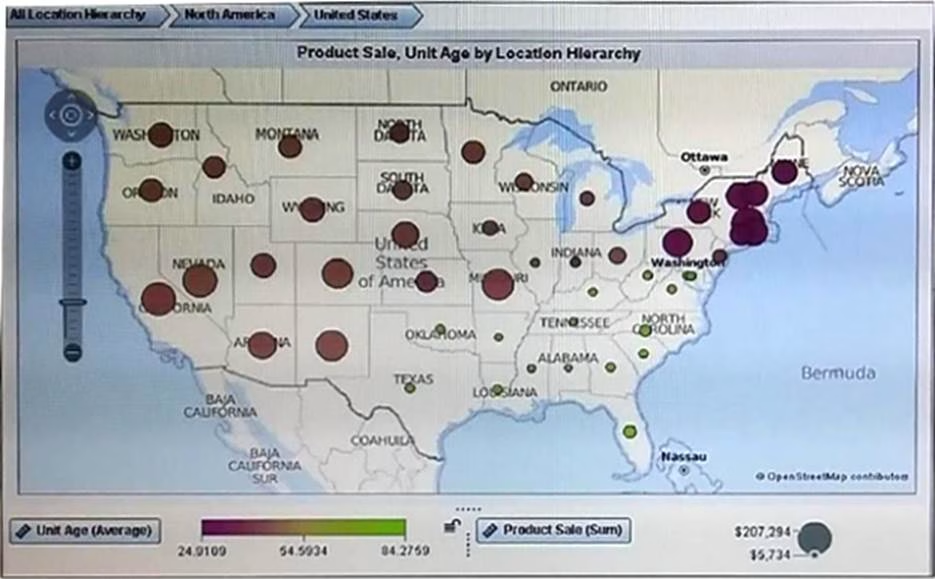

What must a content developer do to create this chart using the automatic chart visualization? (Choose Three).
- A . Select the geo map visualization
- B . Hold down the ctrl key and drag location hierarchy, unit age and product sale to the workspace.
- C . Hold down the ctrl key and drag continent, country, State, Unit age and product sale onto the work space
- D . Specify the continent, country, and state as geometry data items
- E . Create the location Hierarchy that uses continent, country, and state geography data items
In SAS VA designer, the data items in the data tab are displayed based on classification.
What is the process to group data items on the data tab in alphabetical order.
- A . Select options on the data tab, and select Group items by first letter
- B . Select options on the data tab, and select refresh tab
- C . Right click in the data tab and select refresh data
- D . Right click on the data tab and select sort alphabetically.
Refer to the Exhibit below:
The Create Date Hierarchy option was used in SAS Visual Analytics Explorer to create the hierarchy shown…..
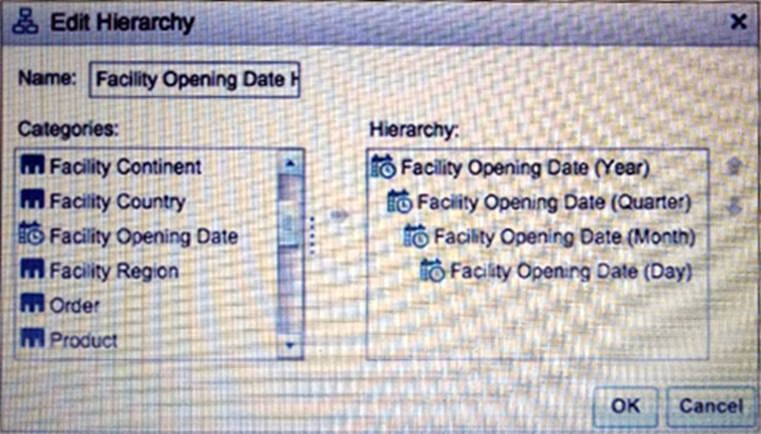

Which statement is true about Facility Opening Date (Day)?
- A . As a Member of a Hierarchy Facility opening Date is a virtual data item without properties.
- B . Facility Opening date (Day) can be used outside of the Hierarchy.
- C . Facility Opening Date (Day) Can be used outside of the Hierarchy after selecting it in the Show or Hide Data Item window.
- D . Because it is the part of a Hierarchy the format for Facility Opening Date (Day) Cannot be Changed.
Which method is not used to share Explorations from SAS Visual Analytics Explorer?
- A . Export the exploration as a PDF.
- B . Export the Exploration as a Report
- C . Email a Link to the Exploration.
- D . Export the exploration as an Image
Refer to the exhibit:
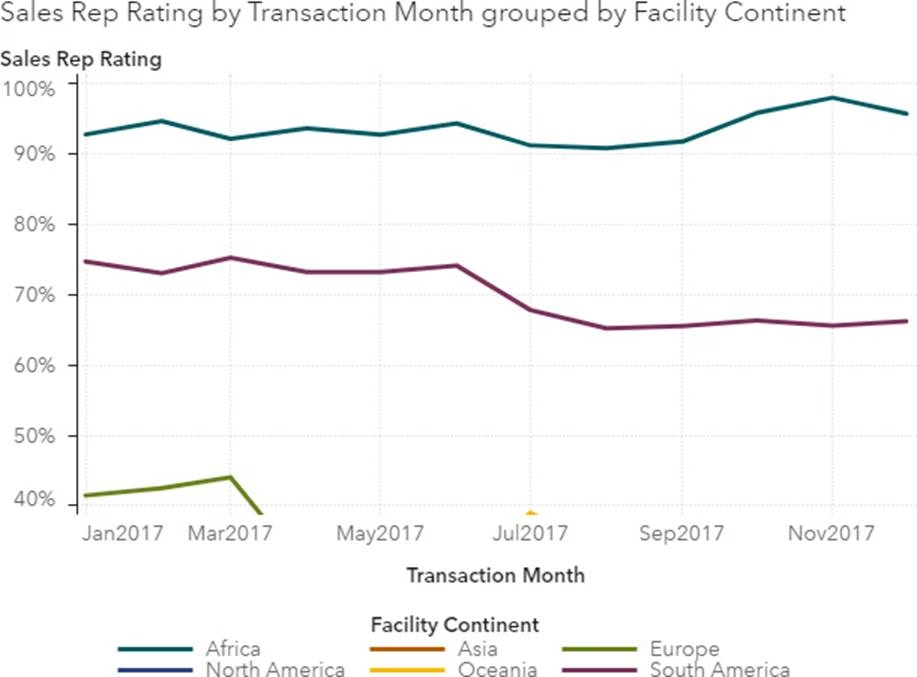

The report designer has just changed the filter to add more data to this line chart.
Why are some of the lines outside of view?
- A . Fixed minimum and maximum has been set on the axis.
- B . The data does not fit.
- C . There is too much data for a line chart.
- D . Data outside of the chart can be ignored.
Which action in the SAS Visual Analytics Explorer creates Stacked bar charts:

- A . Assign a category to the group role, then select stack as the grouping style in the properties tab
- B . Assign a category to the Grouping role
- C . Assign a category to the Grouping Style
- D . Assign a category to the lattice columns, then select stack as the display rule.
In a bar chart created in SAS Visual Analytics Designer, what is the effect of setting the grouping scale property to normalize groups to 100%?
- A . Bar charts that use lattice column data items are adjusted so that measures are totaled to 100% across the entire chart.
- B . Bar charts that group a data item are adjusted so that measures in each separate group total 100%
- C . Bar charts that use lattice column data items are adjusted so that measures in each separate lattice column total 100%.
- D . Bar chart that group a data item are adjusted so that measures are totaled to 100% across the entire chart.
A category and measure are dragged to the report canvas, and a bar chart is automatically created.
If you wanted to use a treemap instead, what action would you take?
- A . Right-click the bar chart and select Change Bar Chart to.
- B . Change the name of bar chart to treemap in the Options pane.
- C . Add a second measure to automatically change the object.
- D . Drag a treemap on top of the bar chart to change the object.
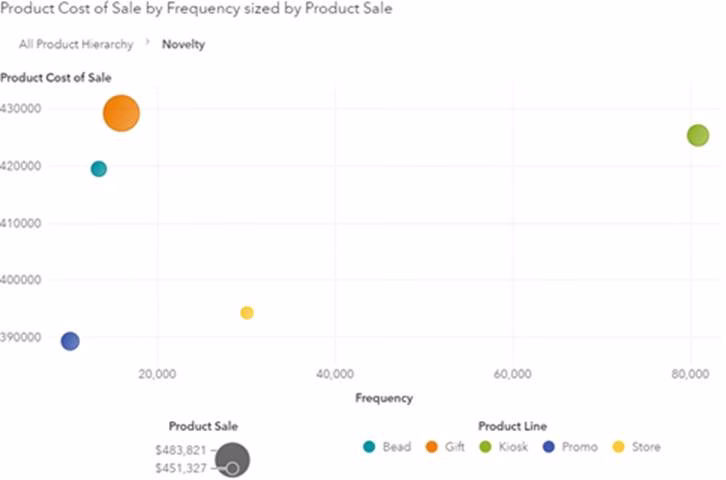
Refer to the exhibit below:
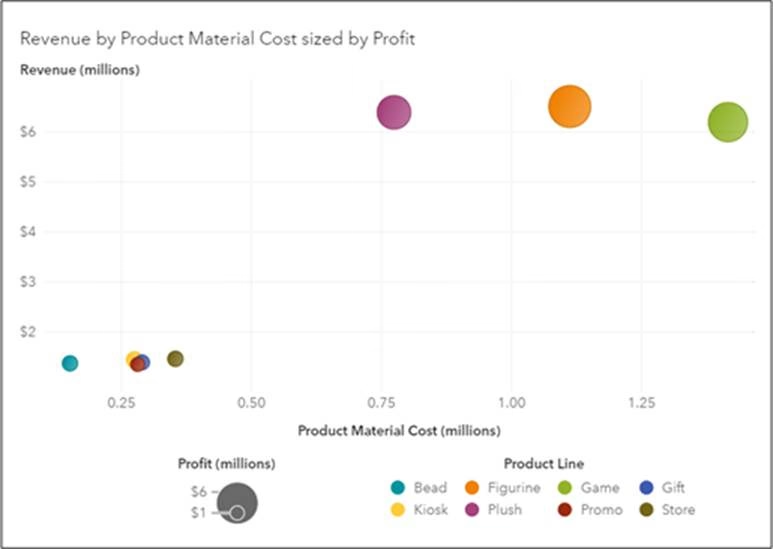

For this Bubble plot object created in SAS Visual Analytics, which statement about the data item role assignments is true?
- A . Revenue is assigned to the Lattice rows role.
- B . Product Line is assigned to the Group role.
- C . Profit is assigned to the Animation role.
- D . Product Material Cost is assigned to the Measures role.
In SAS VA Designer, all report objects have a property ‘Enable selection in the viewers’. when enabled how does this property affect the report object when viewed on a mobile device?
- A . Users can specify additional properties for the object
- B . Users can rearrange its position in the report
- C . Users can view information about the object
- D . Users can remove the object from the report
The following comma-delimited file is imported into SAS Visual Analytics:
– Product, Color, Size, SKU, Cost
– Bead, Black,20mm,107712,100
– Bead, Blue,4mm,435770,50
– Bead, Clear,20mm,1BC123,100
– Bead, Gold,20mm,FA3445,100
– Bead, Green,20mm,98A421,100
Assume the first row contains column names, and the number of rows scanned on import is 2.
What type of data item will SKU be?
- A . Category
- B . Measure
- C . Datetime
- D . Parameter
Refer to the exhibit:
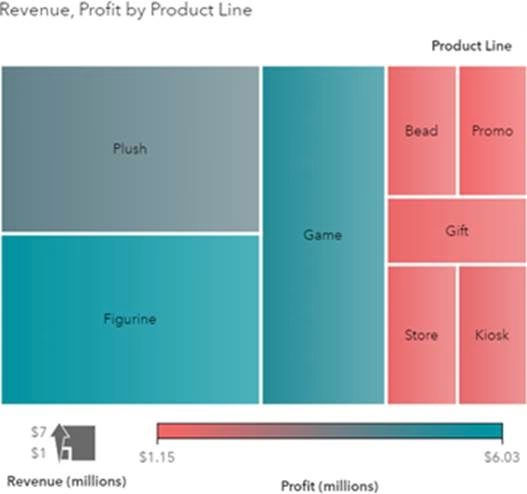

In this treemap from SAS Visual Analytics, Profit is currently assigned the role of Color.
If Profit were removed from this role, what would happen?
- A . The tiles would be colored using the frequency of Revenue.
- B . Visual Analytics would issue an error, and the treemap would not be populated.
- C . The tiles would be colored using the frequency of Product Line
- D . The tiles would all be the same color.
In SAS Visual Analytics Designer, which part of the user interface allows you to change the classification property of a data item.
- A . Select options on the data tab, and select Data properties.
- B . Right click on the data item
- C . Roles tab in the right pane
- D . Select options on the data tab, and select measure details.
Refer to the exhibit:
![]()

This button is available from the text object. When selected, what will display in the text object?
- A . Report created time
- B . Analytic server start time
- C . Table modified time
- D . Page modified time
There are two visualizations given in the area:
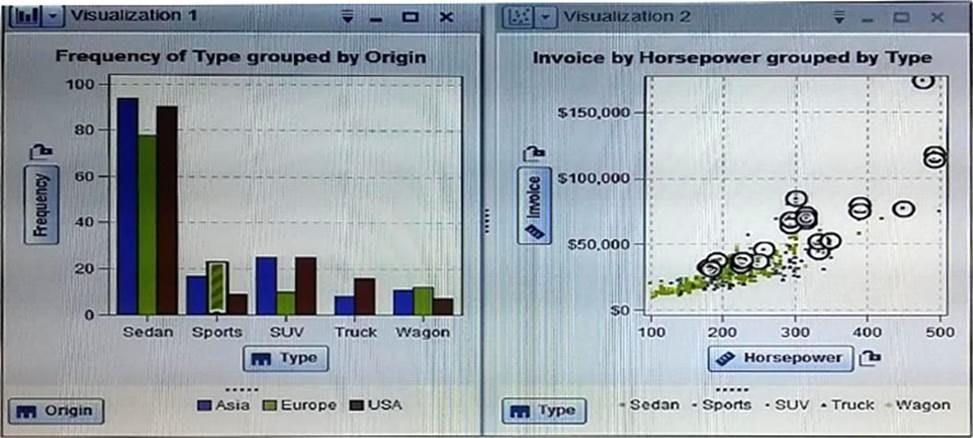

When a bar is selected in the bar chart, the markers in the scatter plot that correspond to the selected value in the bar area are highlighted.
This feature used in SAS Visual Analytics Explorer called:
- A . Report level display rules
- B . Data Brushing
- C . Conditional Highlighting
- D . File interaction
SAS Visual Analytics assigns colors dynamically to category values to grouped visualizations.
How would a content developer specify a specific color for a category Values?
- A . Right-click on the Category item from the Data Pane and select New Custom Category.
- B . Right click on the category data item from the Data Pane and select Colors
- C . Change the grouping style on the properties tab in the right pane
- D . Define a color mapped value display rule for the category data item.
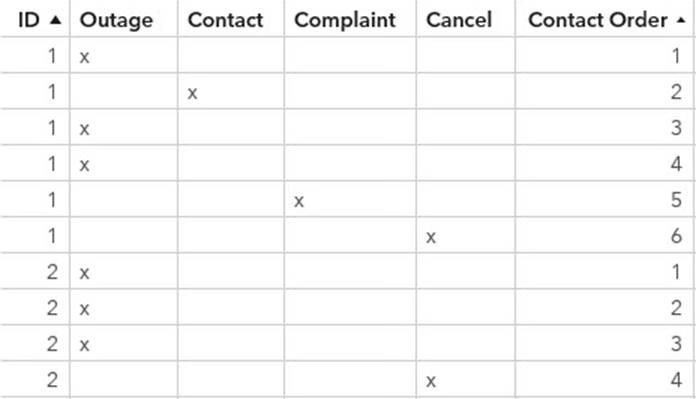
Which source table is structured appropriately for path analysis?
A)
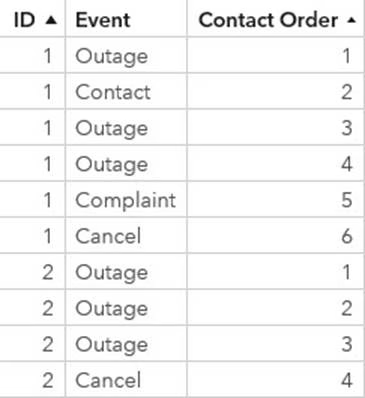

B)
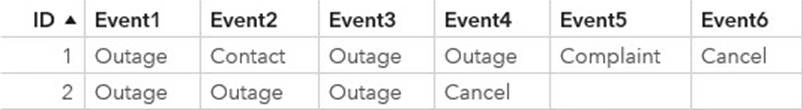

C)
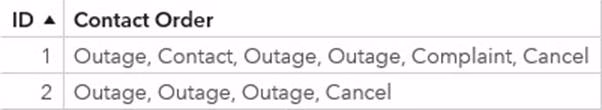

D)

- A . Option A
- B . Option B
- C . Option C
- D . Option D
Refer to the exhibit:
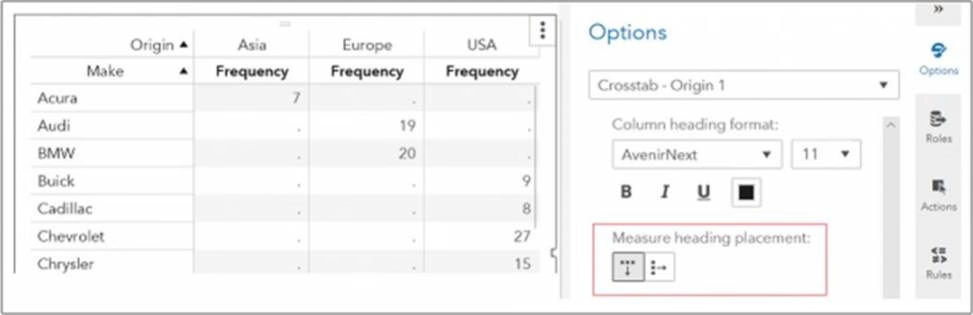

Which is TRUE when the Measure heading placement is changed?
- A . Frequency is moved to the rows.
- B . Origin and Frequency are moved to the rows.
- C . The rows and columns are transposed.
- D . Frequency is left justified on the column.
In SAS Visual Analytics Designer, all report objects have a property ‘Enable selection in the viewers’.
When enabled how does this property affect the report object when viewed on a mobile device?
- A . Users can specify additional properties for the object
- B . Users can rearrange its position in the report
- C . Users can view information about the object
- D . Users can remove the object from the report