SAS Institute A00-470 SAS Visual Analytics Using SAS Viya Online Training
SAS Institute A00-470 Online Training
The questions for A00-470 were last updated at Dec 26,2025.
- Exam Code: A00-470
- Exam Name: SAS Visual Analytics Using SAS Viya
- Certification Provider: SAS Institute
- Latest update: Dec 26,2025
In SAS VA Designer, all report objects have a property ‘Enable selection in the viewers’. when enabled how does this property affect the report object when viewed on a mobile device?
- A . Users can specify additional properties for the object
- B . Users can rearrange its position in the report
- C . Users can view information about the object
- D . Users can remove the object from the report
The following comma-delimited file is imported into SAS Visual Analytics:
– Product, Color, Size, SKU, Cost
– Bead, Black,20mm,107712,100
– Bead, Blue,4mm,435770,50
– Bead, Clear,20mm,1BC123,100
– Bead, Gold,20mm,FA3445,100
– Bead, Green,20mm,98A421,100
Assume the first row contains column names, and the number of rows scanned on import is 2.
What type of data item will SKU be?
- A . Category
- B . Measure
- C . Datetime
- D . Parameter
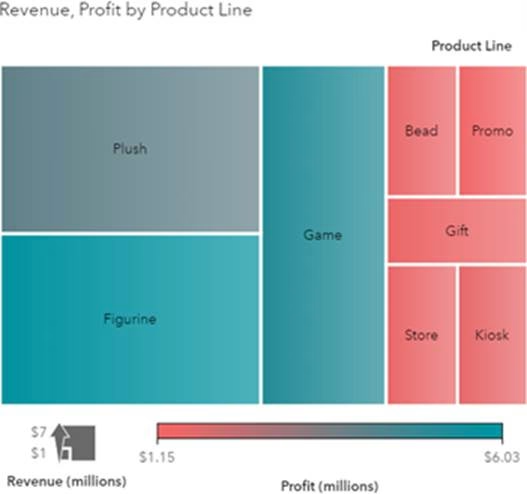
Refer to the exhibit:

In this treemap from SAS Visual Analytics, Profit is currently assigned the role of Color.
If Profit were removed from this role, what would happen?
- A . The tiles would be colored using the frequency of Revenue.
- B . Visual Analytics would issue an error, and the treemap would not be populated.
- C . The tiles would be colored using the frequency of Product Line
- D . The tiles would all be the same color.
In SAS Visual Analytics Designer, which part of the user interface allows you to change the classification property of a data item.
- A . Select options on the data tab, and select Data properties.
- B . Right click on the data item
- C . Roles tab in the right pane
- D . Select options on the data tab, and select measure details.
Refer to the exhibit:
![]()
This button is available from the text object. When selected, what will display in the text object?
- A . Report created time
- B . Analytic server start time
- C . Table modified time
- D . Page modified time
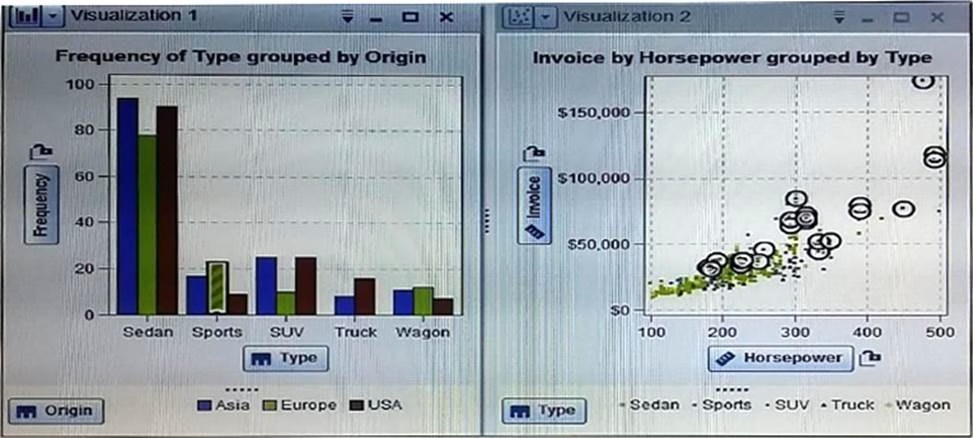
There are two visualizations given in the area:

When a bar is selected in the bar chart, the markers in the scatter plot that correspond to the selected value in the bar area are highlighted.
This feature used in SAS Visual Analytics Explorer called:
- A . Report level display rules
- B . Data Brushing
- C . Conditional Highlighting
- D . File interaction
SAS Visual Analytics assigns colors dynamically to category values to grouped visualizations.
How would a content developer specify a specific color for a category Values?
- A . Right-click on the Category item from the Data Pane and select New Custom Category.
- B . Right click on the category data item from the Data Pane and select Colors
- C . Change the grouping style on the properties tab in the right pane
- D . Define a color mapped value display rule for the category data item.
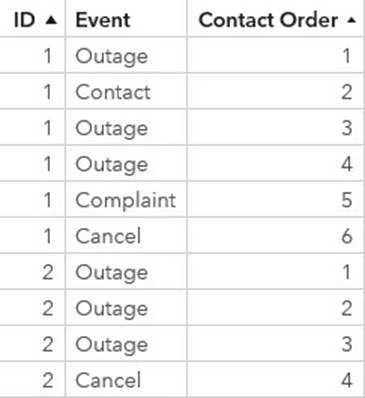
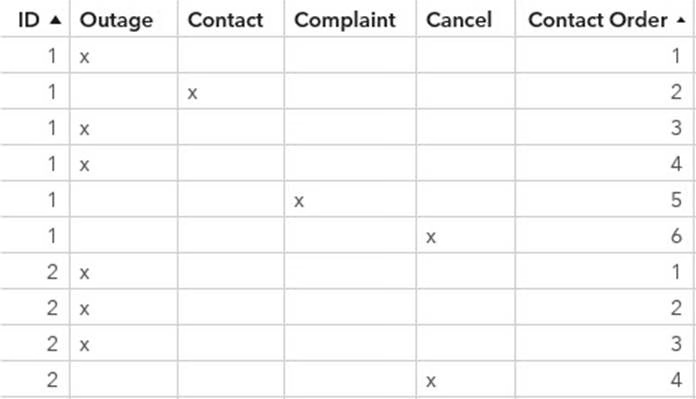
Which source table is structured appropriately for path analysis?
A)

B)

C)

D)

- A . Option A
- B . Option B
- C . Option C
- D . Option D
Refer to the exhibit:

Which is TRUE when the Measure heading placement is changed?
- A . Frequency is moved to the rows.
- B . Origin and Frequency are moved to the rows.
- C . The rows and columns are transposed.
- D . Frequency is left justified on the column.
In SAS Visual Analytics Designer, all report objects have a property ‘Enable selection in the viewers’.
When enabled how does this property affect the report object when viewed on a mobile device?
- A . Users can specify additional properties for the object
- B . Users can rearrange its position in the report
- C . Users can view information about the object
- D . Users can remove the object from the report
Latest A00-470 Dumps Valid Version with 130 Q&As
Latest And Valid Q&A | Instant Download | Once Fail, Full Refund

