SAS Institute A00-470 SAS Visual Analytics Using SAS Viya Online Training
SAS Institute A00-470 Online Training
The questions for A00-470 were last updated at Dec 16,2025.
- Exam Code: A00-470
- Exam Name: SAS Visual Analytics Using SAS Viya
- Certification Provider: SAS Institute
- Latest update: Dec 16,2025
Refer to the exhibit:
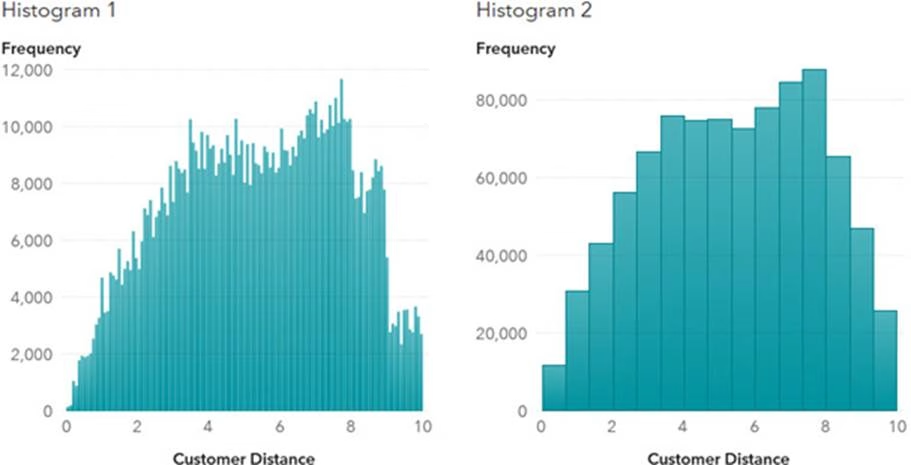
Which method does the report designer use to change Histogram 1 to Histogram 2?
- A . Change the aggregation to minimum.
- B . Remove the data source filter.
- C . Reduce the number of bins.
- D . Change the scale on the Y-axis.
Refer the exhibit below, USA Map shown:
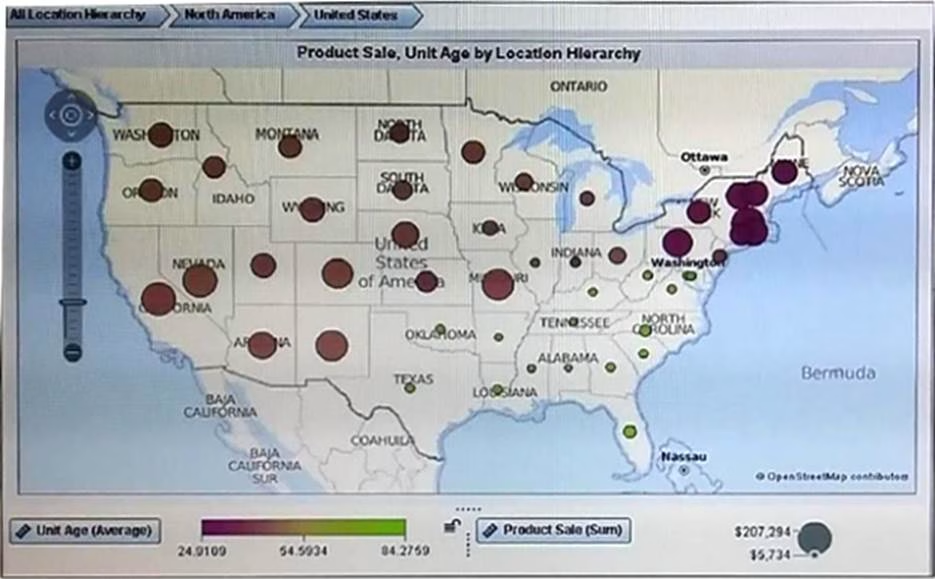
What must a content developer do to create this chart using the automatic chart visualization? (Choose Three).
- A . Select the geo map visualization
- B . Hold down the ctrl key and drag location hierarchy, unit age and product sale to the workspace.
- C . Hold down the ctrl key and drag continent, country, State, Unit age and product sale onto the work space
- D . Specify the continent, country, and state as geometry data items
- E . Create the location Hierarchy that uses continent, country, and state geography data items
In SAS VA designer, the data items in the data tab are displayed based on classification.
What is the process to group data items on the data tab in alphabetical order.
- A . Select options on the data tab, and select Group items by first letter
- B . Select options on the data tab, and select refresh tab
- C . Right click in the data tab and select refresh data
- D . Right click on the data tab and select sort alphabetically.
Refer to the Exhibit below:
The Create Date Hierarchy option was used in SAS Visual Analytics Explorer to create the hierarchy shown…..
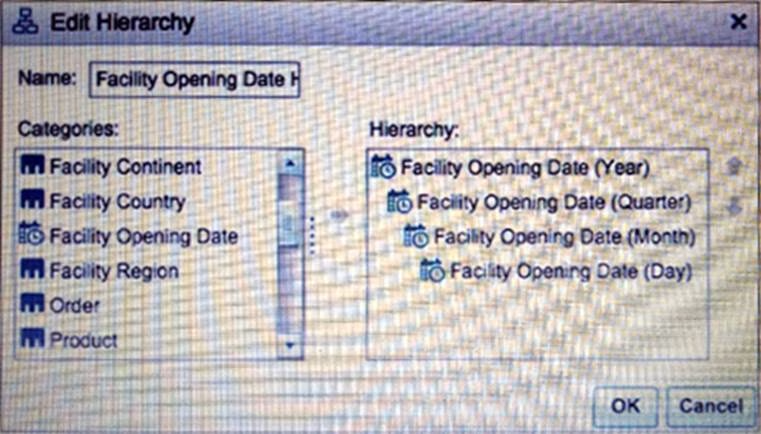
Which statement is true about Facility Opening Date (Day)?
- A . As a Member of a Hierarchy Facility opening Date is a virtual data item without properties.
- B . Facility Opening date (Day) can be used outside of the Hierarchy.
- C . Facility Opening Date (Day) Can be used outside of the Hierarchy after selecting it in the Show or Hide Data Item window.
- D . Because it is the part of a Hierarchy the format for Facility Opening Date (Day) Cannot be Changed.
Which method is not used to share Explorations from SAS Visual Analytics Explorer?
- A . Export the exploration as a PDF.
- B . Export the Exploration as a Report
- C . Email a Link to the Exploration.
- D . Export the exploration as an Image
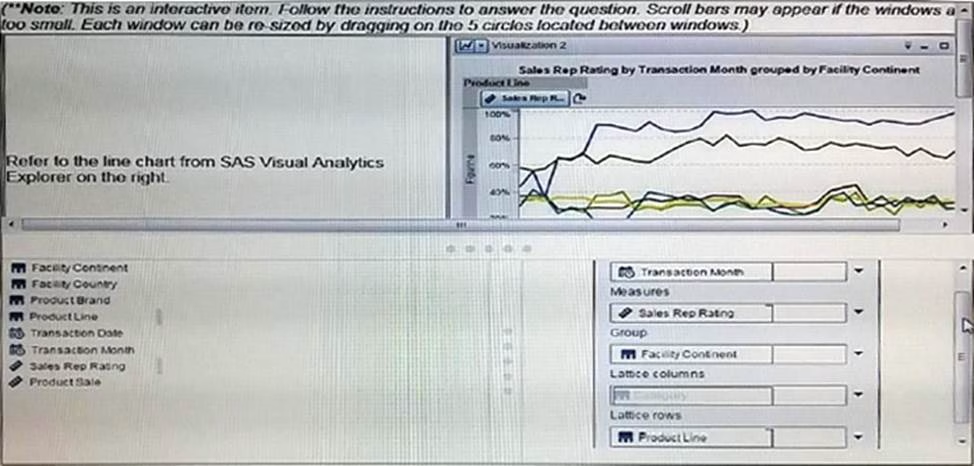
Refer to the exhibit:
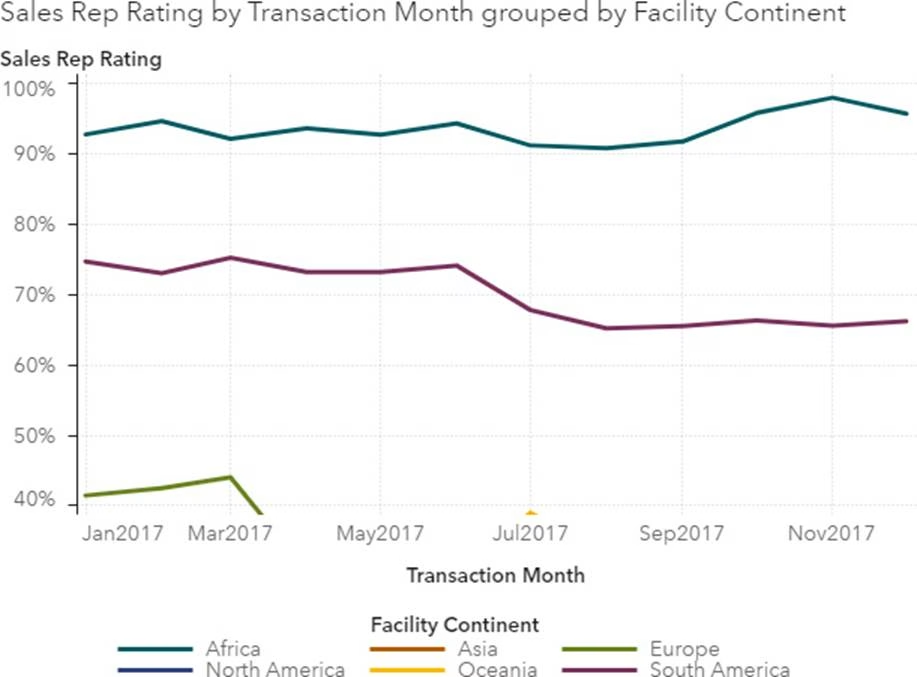
The report designer has just changed the filter to add more data to this line chart.
Why are some of the lines outside of view?
- A . Fixed minimum and maximum has been set on the axis.
- B . The data does not fit.
- C . There is too much data for a line chart.
- D . Data outside of the chart can be ignored.
Which action in the SAS Visual Analytics Explorer creates Stacked bar charts:
- A . Assign a category to the group role, then select stack as the grouping style in the properties tab
- B . Assign a category to the Grouping role
- C . Assign a category to the Grouping Style
- D . Assign a category to the lattice columns, then select stack as the display rule.
In a bar chart created in SAS Visual Analytics Designer, what is the effect of setting the grouping scale property to normalize groups to 100%?
- A . Bar charts that use lattice column data items are adjusted so that measures are totaled to 100% across the entire chart.
- B . Bar charts that group a data item are adjusted so that measures in each separate group total 100%
- C . Bar charts that use lattice column data items are adjusted so that measures in each separate lattice column total 100%.
- D . Bar chart that group a data item are adjusted so that measures are totaled to 100% across the entire chart.
A category and measure are dragged to the report canvas, and a bar chart is automatically created.
If you wanted to use a treemap instead, what action would you take?
- A . Right-click the bar chart and select Change Bar Chart to.
- B . Change the name of bar chart to treemap in the Options pane.
- C . Add a second measure to automatically change the object.
- D . Drag a treemap on top of the bar chart to change the object.
Refer to the exhibit below:
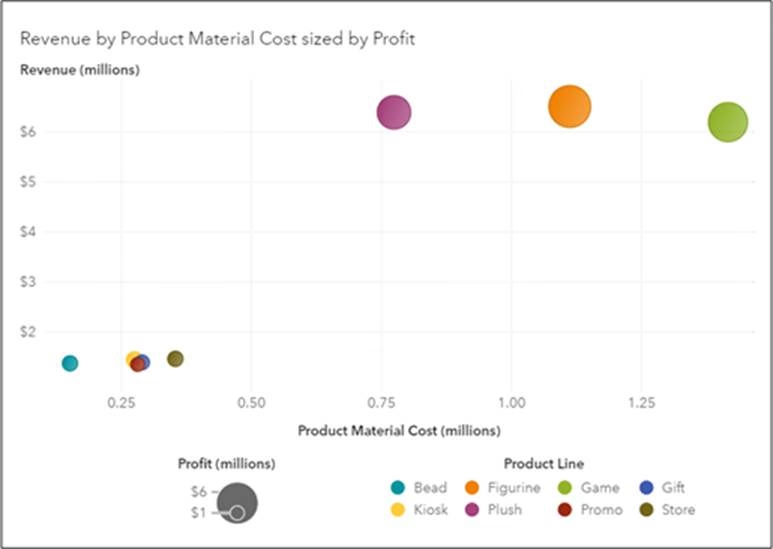
For this Bubble plot object created in SAS Visual Analytics, which statement about the data item role assignments is true?
- A . Revenue is assigned to the Lattice rows role.
- B . Product Line is assigned to the Group role.
- C . Profit is assigned to the Animation role.
- D . Product Material Cost is assigned to the Measures role.
Latest A00-470 Dumps Valid Version with 130 Q&As
Latest And Valid Q&A | Instant Download | Once Fail, Full Refund

