SAS Institute A00-470 SAS Visual Analytics Using SAS Viya Online Training
SAS Institute A00-470 Online Training
The questions for A00-470 were last updated at Feb 15,2025.
- Exam Code: A00-470
- Exam Name: SAS Visual Analytics Using SAS Viya
- Certification Provider: SAS Institute
- Latest update: Feb 15,2025
In SAS Visual Analytics Designer, which statement is not true about text objects?
- A . Text objects enable you to define section links
- B . Text objects enable you to define report links
- C . Text objects enable you to define Exploration links
- D . Text objects enable you to define info window links
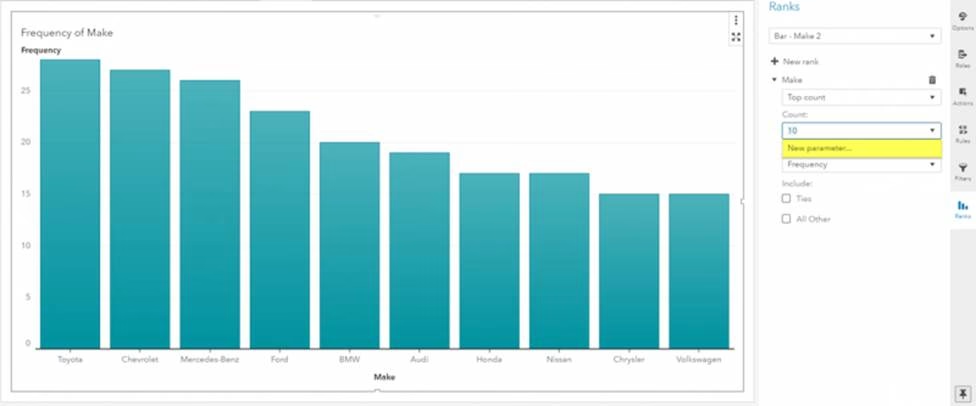
Refer to the exhibit:

The bar chart object has a rank based on the top ten car makes by Frequency.
What is the effect of selecting the New parameter option from the Count menu?
- A . The value of the parameter will update the number of bars shown in the bar chart.
- B . A filter will be created using the value of the parameter to subset the number of bars shown in the bar chart.
- C . The parameter will allow you to change the By group from Frequency to another measure.
- D . The parameter will allow you to change Top Count to either Bottom Count, Top Percent, or Bottom Percent.
For a cross tab report object created in SAS Visual Analytics Designer, which statement is true?
- A . If a hierarchy data item is assigned to the rows role, no other data items may be assigned to the rows role.
- B . A geography data item that has custom latitude and longitude specified may be added to row data items.
- C . Filters may be applied to both row and column data items, but ranks can only be applied to row data items.
- D . Ascending and descending sorting may be used with both row and column data items but a custom sort can only be used with row data items.
In SAS Visual Analytics Designer, the crosstab report object supports which feature?
- A . scenario analysis
- B . Create Hierarchy
- C . Goal Seeking
- D . Add Sparkline
When working with the text topics object, what must the report designer set in order to use it in a report?
- A . Category
- B . Measure
- C . Sentiment collection
- D . Unique row identifier
Which statement is TRUE when importing an Excel file with multiple worksheets into SAS Visual Analytics?
- A . All selected worksheets are imported and concatenated.
- B . You CAN choose the worksheet to be imported.
- C . You CANNOT import Excel files with multiple worksheets.
- D . All selected worksheets are imported and joined.
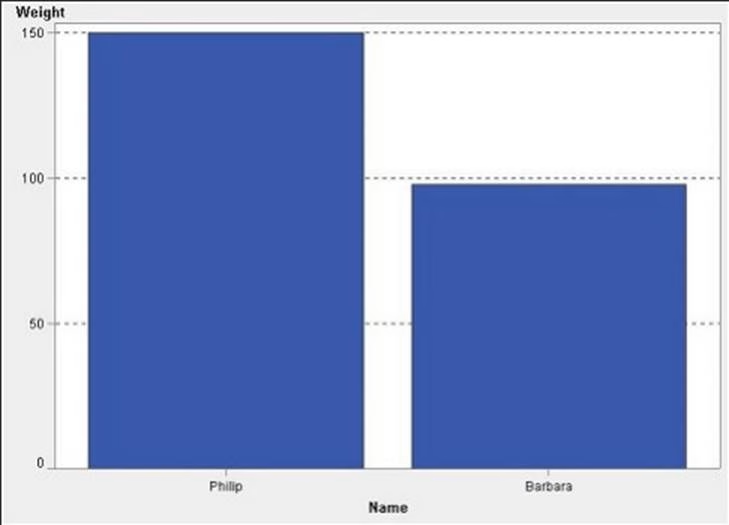
Refer to the bar chart from SAS Visual Analytics Designer.

Philip is 16 years old. Barbara is 13 years old.
What happens to the graph above if the content developer creates a Display Rule to set the graph to red if "Age > 14"?
- A . The Philip bar would turn red.
- B . None of the bars change.
- C . On the graph only the Philip bar displays.
- D . Age replaces the Weight measure.
Refer the exhibit below:

A content developer creates the above report in SAS Visual Analytics Designer. The report contains a report prompt, where year is set to 2010, and a section prompt on section 1 where region is set to south.
How will this report be filtered based on these prompt values?
- A . Section1 will be filtered for region=south. section 2 will be filtered for year=2010
- B . Section1 and section 2 will be filtered for region=south and for year=2010
- C . Section1 will be filtered for Year=2010 and region=south. section 2 will be filtered for year=2010
- D . Section1 will be filtered for Year=2010 and region=south. section 2 will not be filtered.
How is a link created from a chart to a SAS stored process in SAS Visual Analytics Designer?
- A . Select the link to stored process button on the charts properties tab
- B . Select insert > other > stored process link from the main menu
- C . Select the link to stored process button on the create external Link dialog
- D . Drag and drop the stored process report object onto the chart.
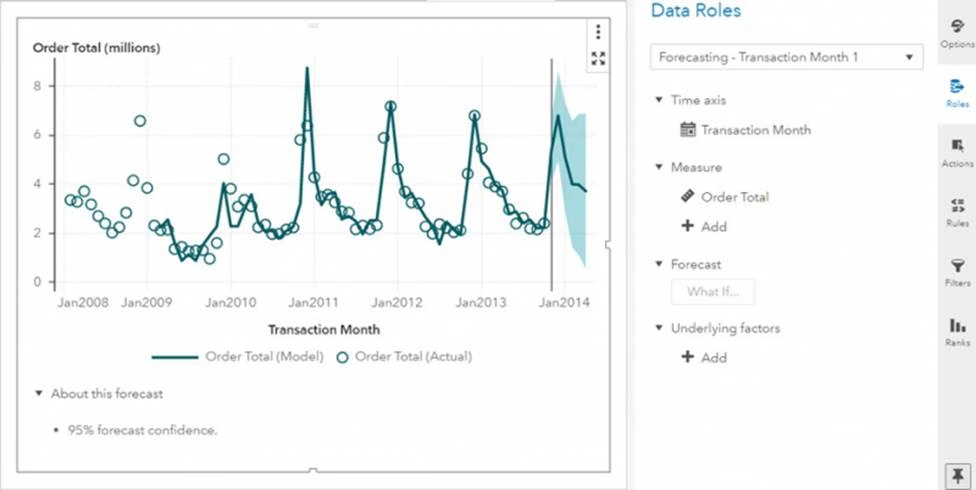
Refer to the exhibit:

The chart has been filtered to display Year > 2007. The forecast confidence is 95%.
What must you do if you want to enable the What If button in the Roles pane?
- A . Add underlying factors
- B . Expand the forecast horizon
- C . Remove the filter
- D . Increase the forecast confidence
Latest A00-470 Dumps Valid Version with 130 Q&As
Latest And Valid Q&A | Instant Download | Once Fail, Full Refund

