SAS Institute A00-470 SAS Visual Analytics Using SAS Viya Online Training
SAS Institute A00-470 Online Training
The questions for A00-470 were last updated at Dec 26,2025.
- Exam Code: A00-470
- Exam Name: SAS Visual Analytics Using SAS Viya
- Certification Provider: SAS Institute
- Latest update: Dec 26,2025
When sorting a list table object, which statement is TRUE?
- A . List tables CAN be sorted by multiple hierarchies.
- B . List tables CAN be sorted by multiple columns.
- C . List tables CANNOT be sorted by a custom category.
- D . List tables are automatically sorted in descending order by the first column.
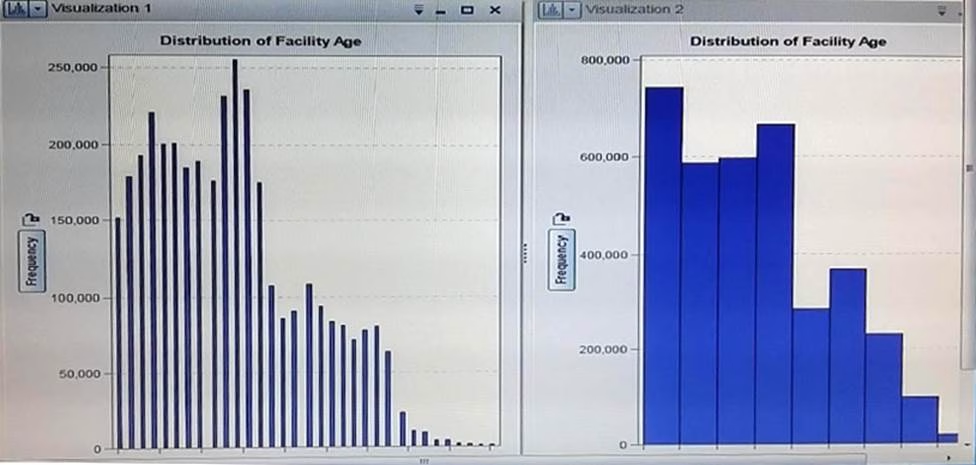
Refer to the exhibit shown:

Two vertical bar charts are shown, first thin lines and the next thick bars.
Which method does the content developer use to change visualization1 to visualization 2.
- A . Change the scale on the Y axis
- B . reduce the number of bins
- C . Remove data source filter
- D . Edit the measure Facility Age to have only one decimal point.
A report designer configures a list control to filter another list control using two-way automatic actions.
The designer should add the two list controls to which area of the report?
- A . Report controls
- B . Report canvas
- C . Page properties
Which statement is TRUE about the Image object?
- A . Scale for the image cannot be adjusted.
- B . Links cannot be added to images.
- C . Images can be loaded from a URL.
- D . An image can be placed in the Report prompt area.
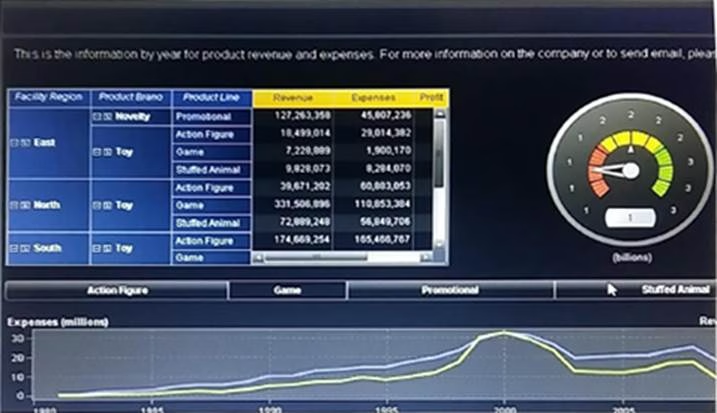
Refer the exhibit below:

What is the minimum number of report objects required to create this report in SAS Visual Analytics Designer.
- A . 5
- B . 4
- C . 3
- D . 6
Which action will cause a list table object to display rows of detail data instead of aggregated data?
- A . Add a new display rule and select Detail Rows for the Applies to value.
- B . Select Detail data in the Options pane.
- C . Include a hierarchy data item in the table and expand the hierarchy to the lowest level.
- D . Include only data items that have an aggregation of ‘None’.
A content developer is working in SAS Visual Analytics Explorer currently the data pane only displays some of the data items in the data source.
Why are some of the data items not displayed?
- A . The content Developer used the Show or Hide Items Window.
- B . The Content Developer added a filter to the Visualization.
- C . The content Developer added a data source filter to the Data source.
- D . The content Developer Grouped the data items by data type.
In SAS Visual Analytics Explorer, which feature explores underlying Factors by specifying Target Values for the Forecast Measure?
- A . Scenario Analysis
- B . Goal Seeking
- C . Forecast targeting
- D . Goal Analysis
Which statements pertaining to multiple data sources in a report are TRUE? (Choose two.)
- A . Each object on a page can use data items from one data source or the other in their roles.
- B . A report prompt can be applied to different data sources if the prompted data item can be mapped between the data sources.
- C . A data filter can use data items from both data sources.
- D . Cardinality thresholds for a report limit the number of rows processed in each of the data sources.
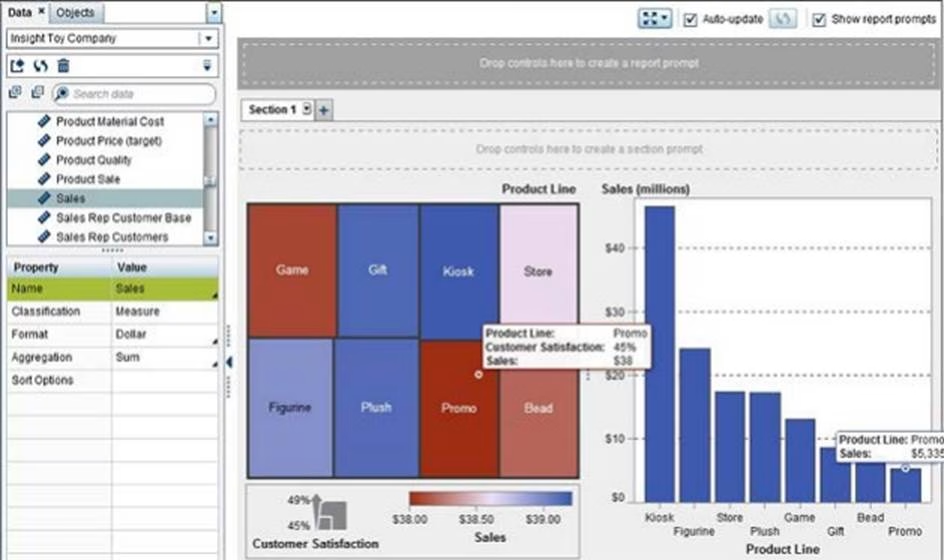
Refer to the exhibit below from SAS Visual Analytics Designer.

Why is the value for Sales lower in the treemap than in the bar chart?
- A . The aggregation for Sales was changed in the treemap.
- B . A rank was established on the treemap to only show the top eight values.
- C . A data source filter was applied to the treemap.
- D . The measure in the treemap is Sales and the measure in the bar chart is Sales (millions).
Latest A00-470 Dumps Valid Version with 130 Q&As
Latest And Valid Q&A | Instant Download | Once Fail, Full Refund

