QlikView QSBA2024 Qlik Sense Business Analyst Certification Exam – 2024 Online Training
QlikView QSBA2024 Online Training
The questions for QSBA2024 were last updated at Mar 06,2025.
- Exam Code: QSBA2024
- Exam Name: Qlik Sense Business Analyst Certification Exam - 2024
- Certification Provider: QlikView
- Latest update: Mar 06,2025
Refer to the exhibit.
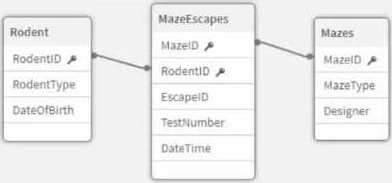
An app that will track experiments for rodents (e.g., rats and mice) that navigate mazes (labyrinths) is being developed. Individual rodents are catalogued in the Rodent table, while the Mazes table has metadata for the mazes. The MazeEscapes table holds a record of each attempt at a maze by a rodent. A business analyst needs to build a KPI that will allow users to see how many rodents have made at least one attempt at any maze.
How should the analyst construct the KPI?
- A . • Create RodentlD AS RodentID_Counter in the MazeEscapes table.
• Use Count (Distinct RodentlD Counter) as the KPI expression. - B . • Create 1 AS RodentID_Counter in the Rodent table.
• Use Sum (RodentlD Counter) as the KPI expression. - C . Create 1 AS RodentID_Counter in the MazeEscapes table.
• Use Sum (RodentlD Counter) as the KPI expression. - D . • Create RodentlD AS RodentlD Counter in the Rodent table.
• Use Count (Distinct RodentID Counter) as the KPI expression.
A business analyst needs to create a visualization that compares two measures over time using a continuous scale that includes a range. The measures will be Profit and Revenue.
Which visualization should the business analyst use?
- A . Line chart
- B . Bullet chart
- C . Bar chart
- D . Scatter plot
The VP of Sales asks a business analyst to include a KPI object on the sales dashboard that shows total sales value for the year 2022, regardless of selections. Existing fields in the data model include Sales and Year.
How should the business analyst write the measure for the KPI object?
- A . Sum ({ < year="|" ‘2022,="" }="" /> } Sales)
- B . Sum ({ $ < year="{" ‘2022*="" )="" /> } Sales)
- C . Sum ({ 1 < year="{" ‘2022’="" )="M /> ) Sales)
- D . Sum (1 { < year="(" ‘2022’="" )="" /> ) Sales)
A banking organization needs a dashboard that shows the following:
• A KPI indicator for current year (CY) versus last year (LY) revenue
• A scatter plot that shows the cost versus revenue of product categories
• A treemap that shows average customer satisfaction rating based on regions
• A table that shows CY cost by record number, financial instrument, and bank
In addition to the customer satisfaction rating, which fields should be used to create the required measures?
- A . CY Revenue, LY Revenue, CY Cost
- B . CY Revenue, LY Revenue, Cost
- C . Revenue and Cost
- D . Revenue and CY Cost
A data analyst is working on a new Qlik Sense application and realizes that some of the required data sources have already been used in previous applications. To streamline the data loading process and maintain consistency, the analyst decides to leverage existing data connections.
What actions should the analyst take to utilize the pre-existing data connections in Qlik Sense?
- A . Copy the script from the old application and paste it into the new application’s script editor
- B . Access the Data load editor and select the desired data connection from the list of available connections
- C . Export the data connection from the old application and import it into the new one
- D . Use a Qlik Sense extension to search and replicate data connections from other applications
Latest QSBA2024 Dumps Valid Version with 50 Q&As
Latest And Valid Q&A | Instant Download | Once Fail, Full Refund
