QlikView QSBA2018 Qlik Sense Business Analyst Certification Exam Online Training
QlikView QSBA2018 Online Training
The questions for QSBA2018 were last updated at Feb 15,2025.
- Exam Code: QSBA2018
- Exam Name: Qlik Sense Business Analyst Certification Exam
- Certification Provider: QlikView
- Latest update: Feb 15,2025
Refer to the exhibit.

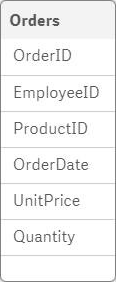
A business analyst must analyze sales using an existing sales order app.
– The Orders table in the app was added from a QVD file using the data manager
– The Orders table in the app and the QVD do NOT contain a SalesAmount field
– SalesAmount can be calculated by multiplying the Quantity and UnitPrice
How should the business analyst add a SalesAmount field into the Orders table?
- A . In the data manager, create a new calculated field, SalesAmount, and set the expression value to Sum (UnitPrice * Quantity)
- B . In the data mode viewer, add a calculated field named SalesAmount with the expression UnitPrice * Quantity
- C . In the data manager, add a calculated field named SalesAmount with the expression UnitPrice * Quantity
- D . In the Orders QVD file, add an additional field named SalesAmount with the expression UnitPrice * Quantity
Refer to the exhibit.

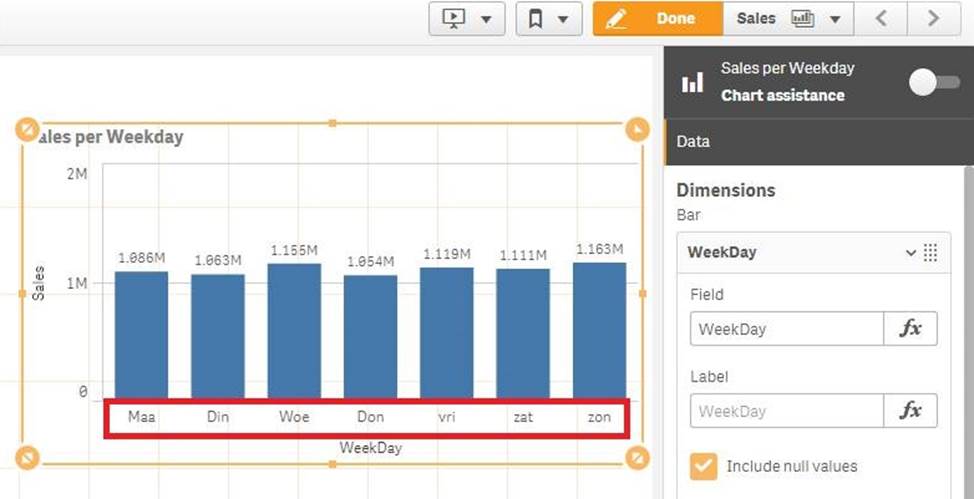
A business analyst creates a bar chart and notices the weekdays are NOT in a US default format. The analyst does NOT have permissions to enter the data load editor and edit the data. The analyst only has a few minutes before the meeting to show the insights to a manager. The business analyst wants to quickly customize the chart to show the weekdays in US format.
Which action should the business analyst take to fix the chart?
- A . Change the dimension label using the DATE () function to specify the right data format.
- B . Change the dimension to a calculated dimension to specify the right data format.
- C . Change the dimension label to a calculated dimension using an IF () function.
- D . Change the dimension to a calculated dimension using the REPLACE () function.
Refer to the exhibits.


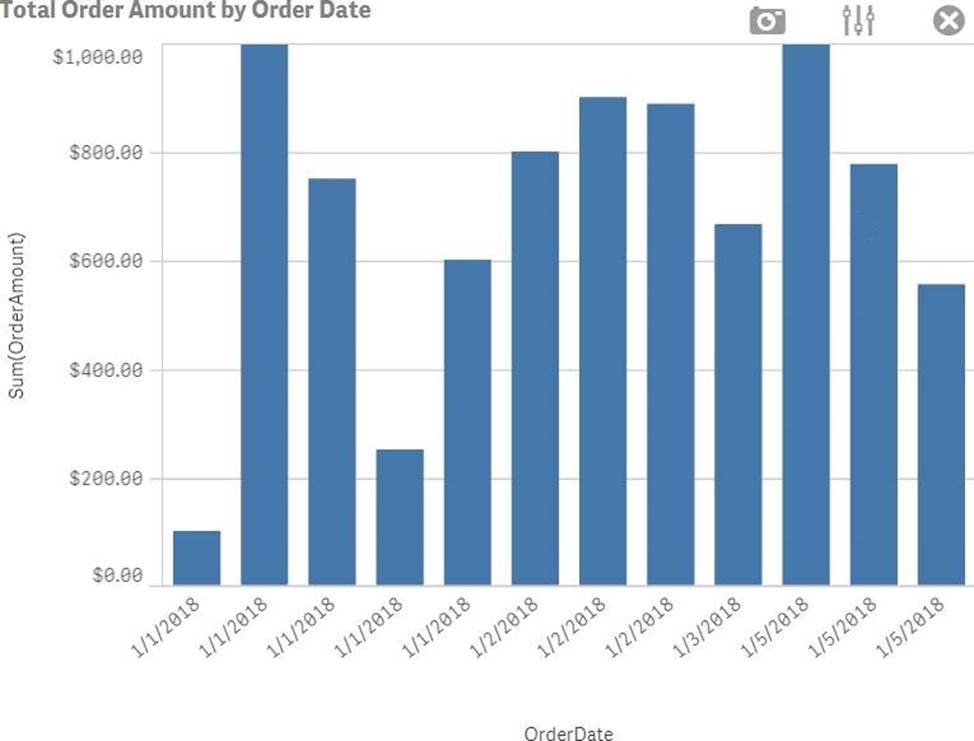
A business analyst must create a bar chart to show the total value of orders processed per day. The dataset loaded by the data architect only contains the OrderNo, OrderDateTime, and OrderAmount. The business analyst creates a calculated field, OrderDate, using the expression, Date (OrderDateTime). The bar chart does NOT present the information correctly.
How should the business analyst fix the error?
- A . Change the OrderDate number formatting to ‘Date’ in the properties panel
- B . Create a new calculated field for OrderDate with: Date (Floor (OrderDateTime))
- C . Change the OrderDate field type to Date’ in the format ‘YYYY-MM-DD’ in the data manager.
- D . Create a new calculated field for OrderDate with: Date (LTrim (OrderDateTime,10))
A business analyst is NOT familiar with the data and is using insight advisor to create a number of visualizations.
Which steps should the business analyst take to add the visualizations to a sheet?
- A . Click Generate insights to find visualizations, then click Add to sheet
- B . Use the selection tool to find visualizations, then click Add to sheet
- C . Use smart search to find visualizations, then click Add to sheet
- D . Drag and drop fields on the workspace, then click Add to sheet
Refer to the exhibit.

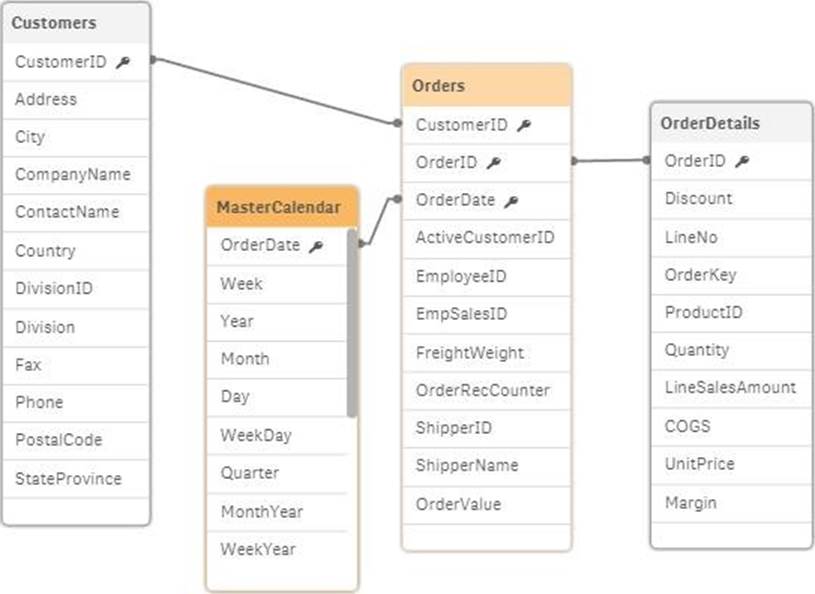
A business analyst is testing an existing app that returns unexpected results.
– Using the selection tool, the business analyst observes the following behavior.
– Select a CompanyName and the associated OrderID records are white
– Select a Year and all OrderID records are gray
– Select an OrderID and the Quarter values are all gray, but the CompanyNames are white
– Select a ProductID and the associated ShipperName and OrderDates are white, but the Year is gray
What is causing these results?
- A . OrderID should be the key field in the MasterCalendar
- B . The logical model is NOT a star schema
- C . The OrderDate fields are different data types
- D . MasterCalendar should be associated to the OrderDetails table
A company has customers in 16 countries. The majority of the customers are in Germany.
A business analyst creates a filter pane for Country, and wants “Germany” listed first. The rest of the countries should be listed in alphabetical order.
Which method should the business analyst use to meet this requirement?
- A . Edit the sheet, select Chart, Properties panel, Custom sorting, then select Germany
- B . Edit the sheet, select Chart, Properties panel, Custom sorting, then click Descending Frequency
- C . In the data manager, edit the table, select Country, then select Order from the data profiling card
- D . In the data manager, edit the table, select Country, then select Order from the column header
Latest QSBA2018 Dumps Valid Version with 50 Q&As
Latest And Valid Q&A | Instant Download | Once Fail, Full Refund

