Microsoft PL-300 Microsoft Power BI Data Analyst Online Training
Microsoft PL-300 Online Training
The questions for PL-300 were last updated at Feb 22,2026.
- Exam Code: PL-300
- Exam Name: Microsoft Power BI Data Analyst
- Certification Provider: Microsoft
- Latest update: Feb 22,2026
HOTSPOT
You have two Azure SQL databases that contain the same tables and columns.
For each database, you create a query that retrieves data from a table named Customers.
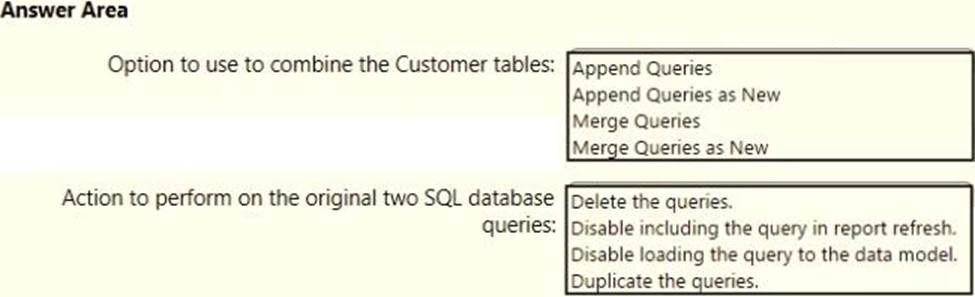
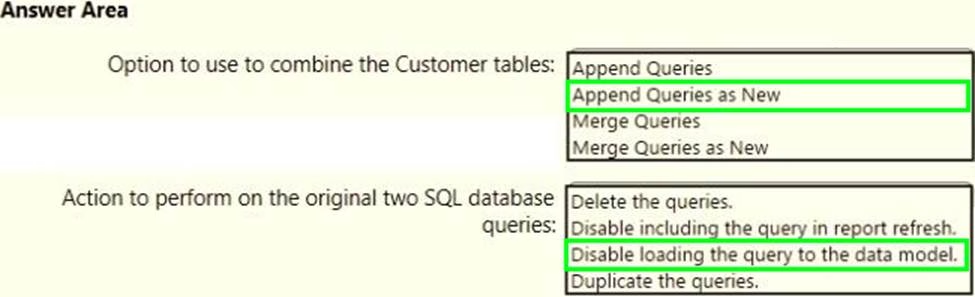
You need to combine the Customer tables into a single table. The solution must minimize the size of the data model and support scheduled refresh in powerbi.com.
What should you do? To answer, select the appropriate options in the answer area. NOTE: Each correct selection is worth one point.
You have a Microsoft SharePoint Online site that contains several document libraries. One of the document libraries contains manufacturing reports saved as Microsoft Excel files. All the manufacturing reports have the same data structure.
You need to load only the manufacturing reports to a table for analysis.
What should you do in Microsoft Power Bl Desktop?
- A . Get data from a SharePoint Online folder, enter the site URL, and then select Combine & Load.
- B . Get data from a SharePoint Online list and enter the site URL. Edit the query and filter by the path to the manufacturing reports library.
- C . Get data from a SharePoint Online folder and enter the site URL. Edit the query and filter by the path to the manufacturing reports library.
- D . Get data from a SharePoint Online list, enter the site URL, and then select Combine & Load.
HOTSPOT
You have a folder of monthly transaction extracts.
You plan to create a report to analyze the transaction data.
You receive the following email message: "Hi. I’ve put 24 files of monthly transaction data onto the shared drive. File Transactions201901.csv through Transactions201912.csv have the latest set of columns, but files Transactions201801.csv to Transactions201812.csv have an older layout without the extra fields needed for analysis. Each file contains 10 to 50 transactions."
You get data from the folder and select Combine & Load.
The Combine Files dialog box is shown in the exhibit. (Click the Exhibit tab.)
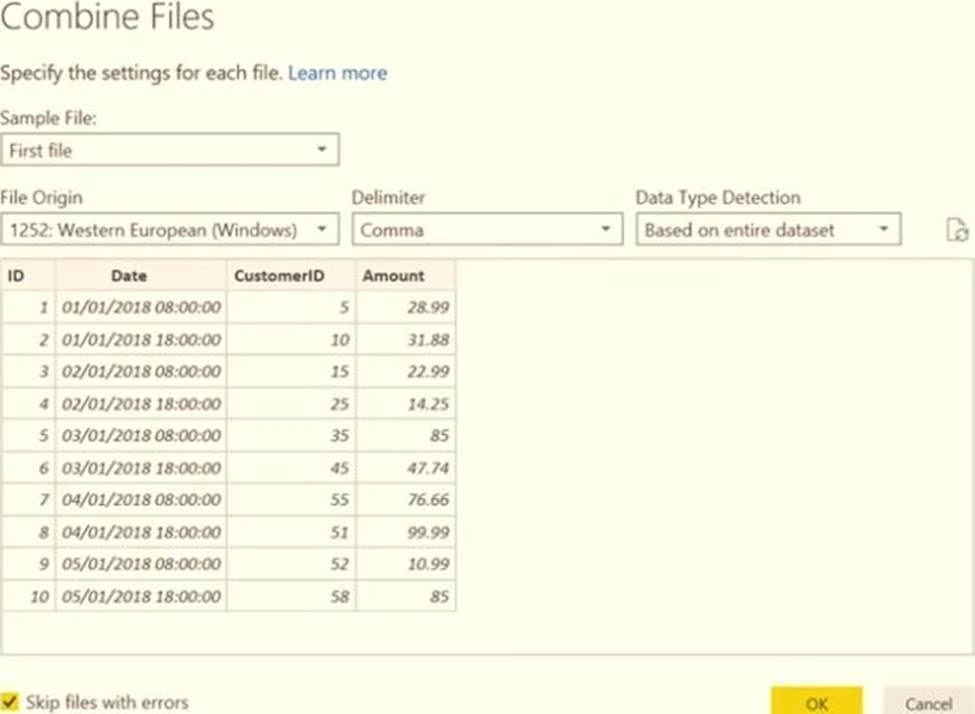
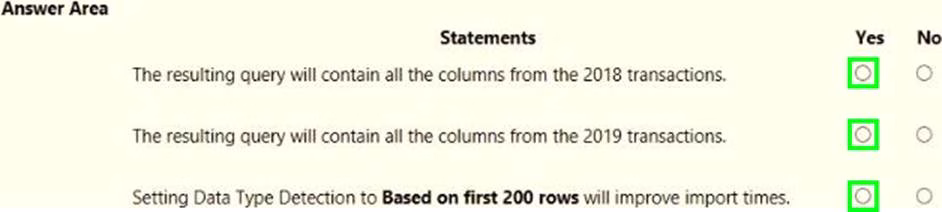
For each of the following statements, select Yes if the statement is true. Otherwise, select No. NOTE: Each correct selection is worth one point.

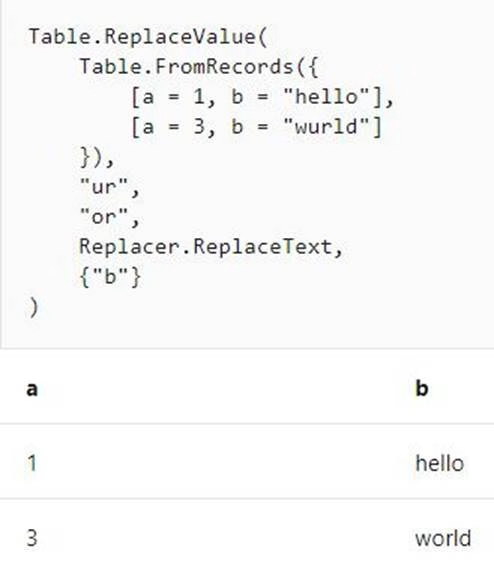
You create the following step by using Power Query Editor.
= Table.ReplaceValue(SalesLT_Address,"1318","1319",Replacer.ReplaceText,{"AddressLine1"})
A row has a value of 21318 Lasalle Street in the AddressLine1 column.
What will the value be when the step is applied?
- A . 1318
- B . 1319
- C . 21318 Lasalle Street
- D . 21319 Lasalle Street
DRAG DROP
You receive revenue data that must be included in Microsoft Power Bl reports.
You perform an initial load of the data from a Microsoft Excel source as shown in the following exhibit.
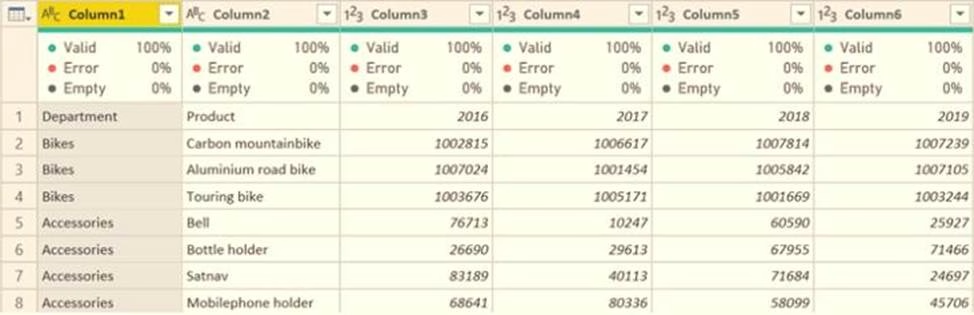
You plan to create several visuals from the data, including a visual that shows revenue split by year and product.
You need to transform the data to ensure that you can build the visuals. The solution must ensure that the columns are named appropriately for the data that they contain.
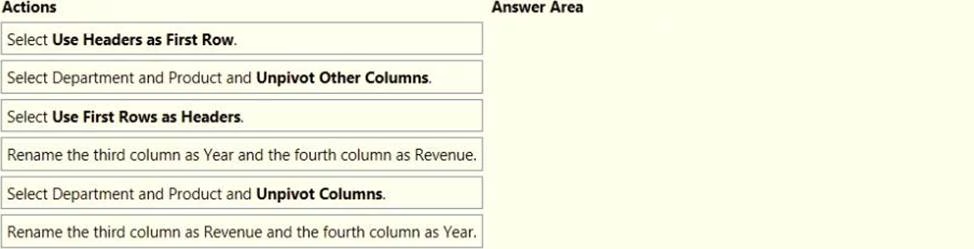
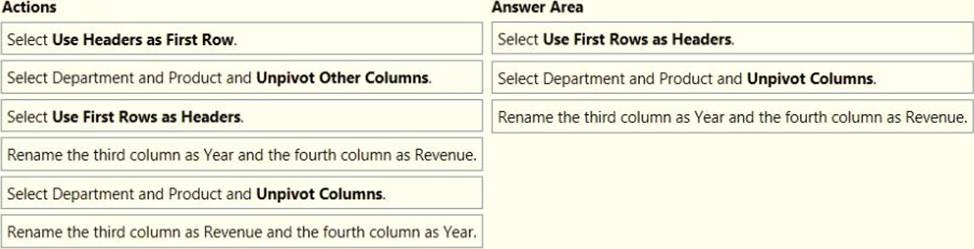
Which three actions should you perform in sequence? To answer, move the appropriate actions from the list of actions to the answer area and arrange them in the correct order.
You import a large dataset to Power Query Editor.
You need to identify whether a column contains only unique values.
Which two Data Preview options can you use? Each correct answer presents a complete solution. NOTE: Each correct selection is worth one point
- A . Show whitespace
- B . Column distribution
- C . Column profile
- D . Column quality
- E . Monospaced
HOTSPOT
You view a query named Transactions as shown in the following exhibit.
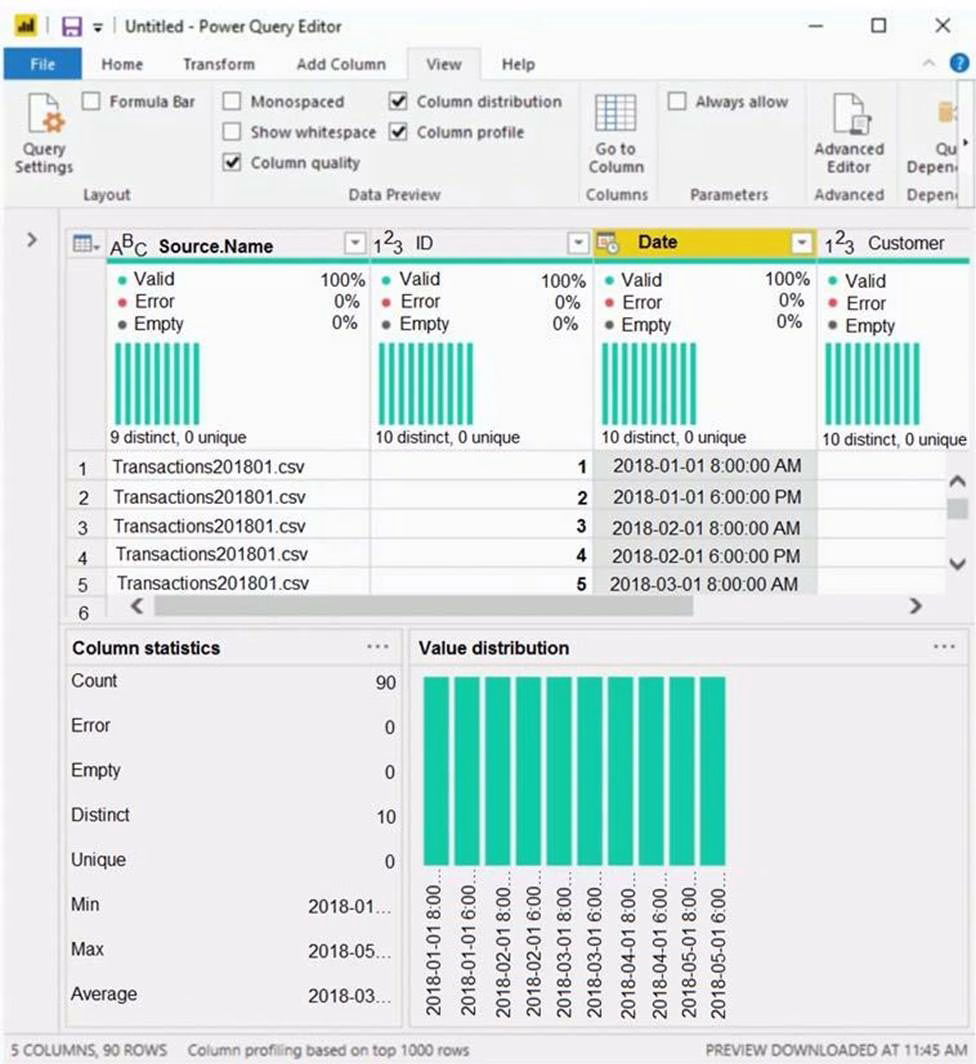
The query gets CSV files from a folder.
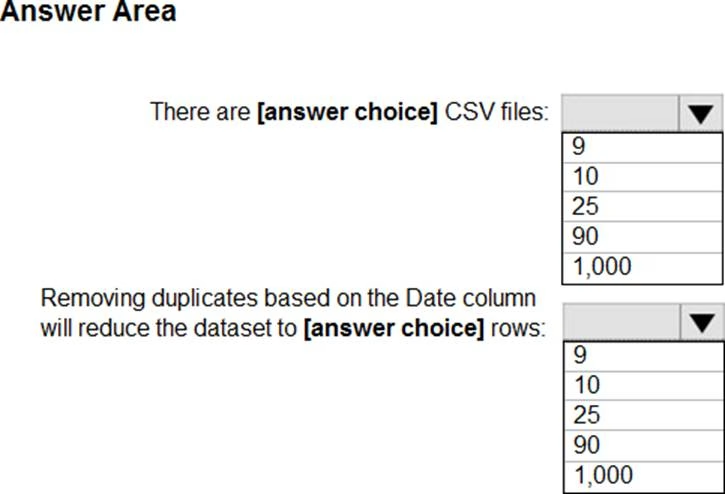
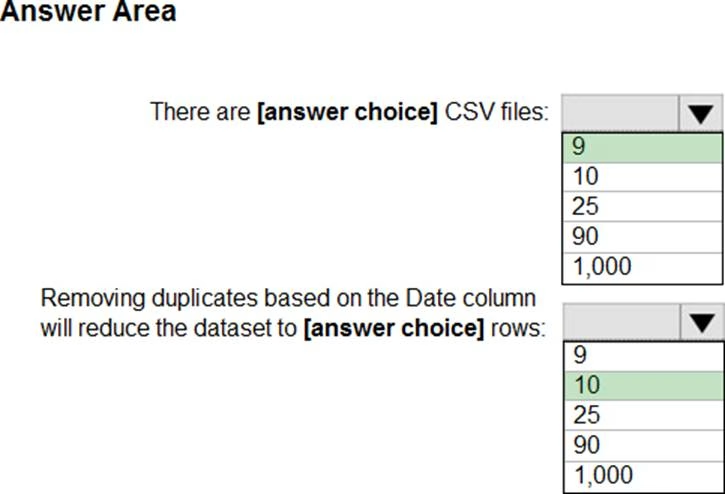
Use the drop-down menus to select the answer choice that completes each statement based on the information presented in the graphic. NOTE: Each correct selection is worth one point.
Your company has employees in 10 states.
The company recently decided to associate each state to one of the following three regions: East, West, and North.
You have a data model that contains employee information by state. The model does NOT include region
information.
You have a report that shows the employees by state.
You need to view the employees by region as quickly as possible.
What should you do?
- A . Create a new aggregation that summarizes by employee.
- B . Create a new group on the state column and set the Group type to List.
- C . Create a new group on the state column and set the Group type to Bin.
- D . Create a new aggregation that summarizes by state.
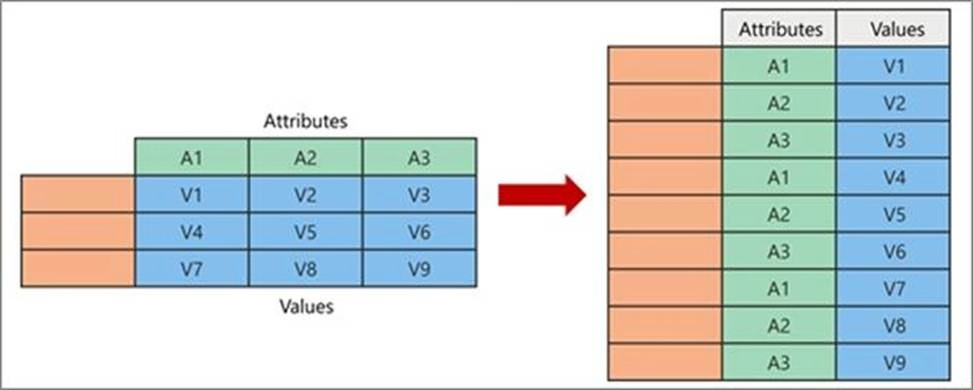
You have a query that returns the data shown in the following exhibit.
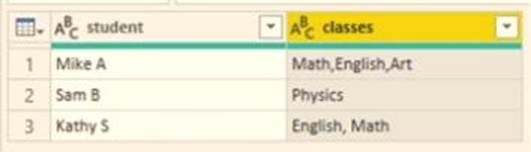
You need to configure the query to display the data as shown in the following exhibit.
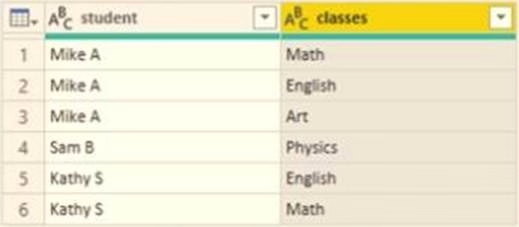
Which step should you use in the query?
- A . =Table.ExpandListColum(Table.TransformColunins(Source, {{"classes". Splitter.SplitTextByDelimiter(”,”, QuoteStyle.None), let itemType – (type nullable text) meta [Serialized.Text = true] in type {itemType}}}), "classes")
- B . = Table.Unpivot(Source, {"classes"}, "Attribute", "Value")
- C . = Table.SplitColumn(Source, "classes". Splitter.SplitTextByDelimiterf",", QuoteStyle.None), {"classes.1"})
- D . = Table.SplitColumn(Source, "classes". Splitter.SplitTextByPositions({10}), {"classes.1"})

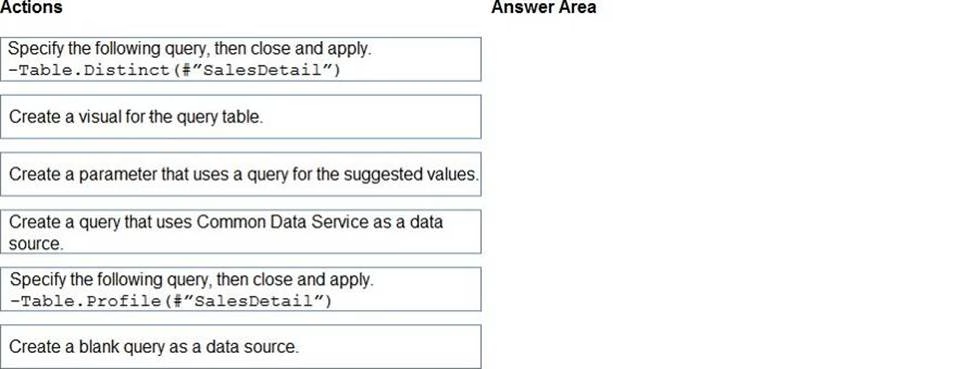
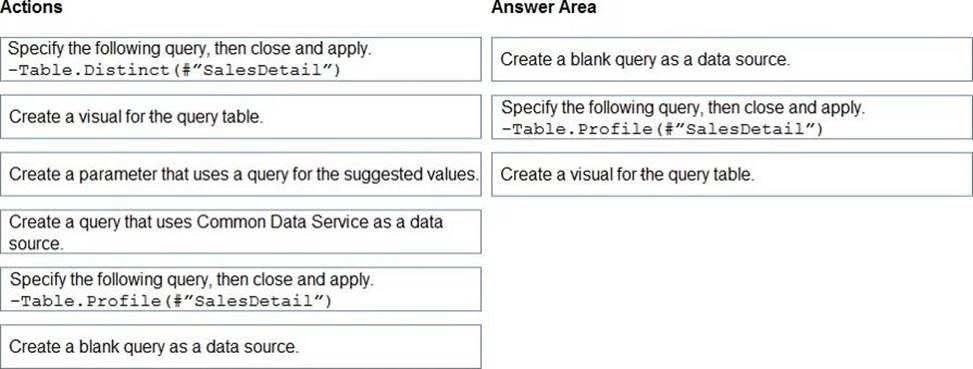
DRAG DROP
You are modeling data in table named SalesDetail by using Microsoft Power Bl.
You need to provide end users with access to the summary statistics about the SalesDetail dat a. The users require insights on the completeness of the data and the value distributions.
Which three actions should you perform in sequence? To answer, move the appropriate actions from the list of actions to the answer area and arrange them in the correct order.
Latest PL-300 Dumps Valid Version with 131 Q&As
Latest And Valid Q&A | Instant Download | Once Fail, Full Refund
