Microsoft PL-300 Microsoft Power BI Data Analyst Online Training
Microsoft PL-300 Online Training
The questions for PL-300 were last updated at Feb 15,2025.
- Exam Code: PL-300
- Exam Name: Microsoft Power BI Data Analyst
- Certification Provider: Microsoft
- Latest update: Feb 15,2025
You have a Microsoft Power Bl report. The size of PBIX file is 550 MB. The report is accessed by using an App workspace in shared capacity of powerbi.com.
The report uses an imported dataset that contains one fact table. The fact table contains 12 million rows. The dataset is scheduled to refresh twice a day at 08:00 and 17:00.
The report is a single page that contains 15 custom visuals and 10 default visuals.
Users say that the report is slow to load the visuals when they access and interact with the report
You need to recommend a solution to improve the performance of the report.
What should you recommend?
- A . Split the visuals onto multiple pages.
- B . Implement row-level security (RLS).
- C . Replace the default visuals with custom visuals.
- D . Increase the number of times that the dataset is refreshed.
DRAG DROP
You have a Microsoft Power Bl workspace.
You need to grant the user capabilities shown in the following table.

The solution must use the principle of least privilege.
Which user role should you assign to each user? To answer, drag the appropriate roles to the correct users. Each role may be used once, more than once, or not at all. You may need to drag the split bar between panes or scroll to view content. NOTE: Each correct selection is worth one point.


Explanation:
User 1 = Member
User 2 = Contributor
https://docs.microsoft.com/en-us/power-bi/collaborate-share/service-new-workspaces
You have four sales regions. Each region has multiple sales managers.
You implement row-level security (RLS) in a data model. You assign the relevant distribution lists to each role.
You have sales reports that enable analysis by region. The sales managers can view the sales records of their region. The sales managers are prevented from viewing records from other regions.
A sales manager changes to a different region.
You need to ensure that the sales manager can see the correct sales data.
What should you do?
- A . From Microsoft Power Bl Desktop, edit the Row-Level Security setting for the reports.
- B . Change the Microsoft Power Bl license type of the sales manager.
- C . Manage the permissions of the underlying dataset
- D . Request that the sales manager be added to the correct Azure Active Directory group.
D
Explanation:
Using AD Security Groups, you no longer need to maintain a long list of users.
All that you will need to do is to put in the AD Security group with the required permissions and Power BI will do the REST! This means a small and simple security file with the permissions and AD Security group.
Note: Configure role mappings
Once published to Power BI, you must map members to dataset roles.
Members can be user accounts or security groups. Whenever possible, we recommend you map security groups to dataset roles. It involves managing security group memberships in Azure Active Directory. Possibly, it delegates the task to your network administrators.
Reference:
https://www.fourmoo.com/2018/02/20/dynamic-row-level-security-is-easy-with-active-directory-security-groups/
https://docs.microsoft.com/en-us/power-bi/guidance/rls-guidance
You have five sales regions. Each region is assigned a single salesperson.
You have an imported dataset that has a dynamic row-level security (RLS) role named Sales. The Sales role filters sales transaction data by salesperson.
Salespeople must see only the data from their region.
You publish the dataset to powerbi.com, set RLS role membership, and distribute the dataset and related reports to the salespeople.
A salesperson reports that she believes she should see more data.
You need to verify what data the salesperson currently sees.
What should you do?
- A . Use the Test as role option to view data as the salesperson’s user account.
- B . Use the Test as role option to view data as the Sales role.
- C . Instruct the salesperson to open the report in Microsoft Power Bl Desktop.
- D . Filter the data in the reports to match the intended logic in the filter on the sales transaction table.
A
Explanation:
Validate the roles within Power BI Desktop
After you’ve created your roles, test the results of the roles within Power BI Desktop.
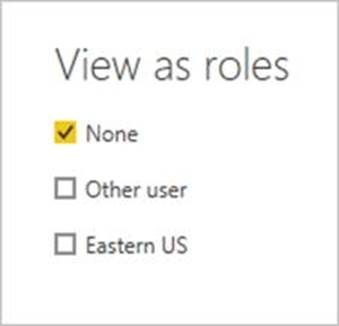
From the Modeling tab, select View as.

The View as roles window appears, where you see the roles you’ve created.

Select a role you created, and then select OK to apply that role.
The report renders the data relevant for that role.
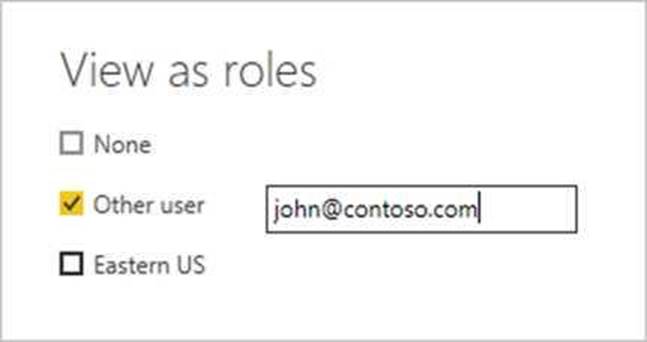
You can also select Other user and supply a given user.

Select OK.
The report renders based on what that user can see.
Reference: https://docs.microsoft.com/en-us/power-bi/admin/service-admin-rls
You have a collection of reports for the HR department of your company. The datasets use row-level security (RLS). The company has multiple sales regions that each has an HR manager. You need to ensure that the HR managers can interact with the data from their region only. The HR managers must be prevented from changing the layout of the reports.
How should you provision access to the reports for the HR managers?
- A . Create a new workspace, copy the datasets and reports, and add the HR managers as members of the workspace.
- B . Publish the reports to a different workspace other than the one hosting the datasets.
- C . Publish the reports in an app and grant the HR managers access permission.
- D . Add the HR managers as members of the existing workspace that hosts the reports and the datasets.
C
Explanation:
Note: Row-level security (RLS) with Power BI can be used to restrict data access for given users. Filters restrict data access at the row level, and you can define filters within roles. In the Power BI service, members of a workspace have access to datasets in the workspace. RLS doesn’t restrict this data access.
Reference: https://docs.microsoft.com/en-us/power-bi/admin/service-admin-rls
Your company plans to completely separate development and production assets such as datasets, reports, and dashboards in Microsoft Power Bl.
You need to recommend an application lifecycle strategy. The solution must minimize maintenance to update access and prevent end users from viewing the development assets.
What should you recommend?
- A . Create production reports in a separate workspace that uses a shared dataset from the development workspace. Grant the end users access to the production workspace.
- B . In the same workspace, create separate copies of the assets and append DEV to the names of the copied assets. Grant the end users access to the workspace.
- C . Create separate workspaces for development and production. Grant the end users access to the production workspace.
- D . Create one workspace for development. From the workspace, publish an app for production.
HOTSPOT
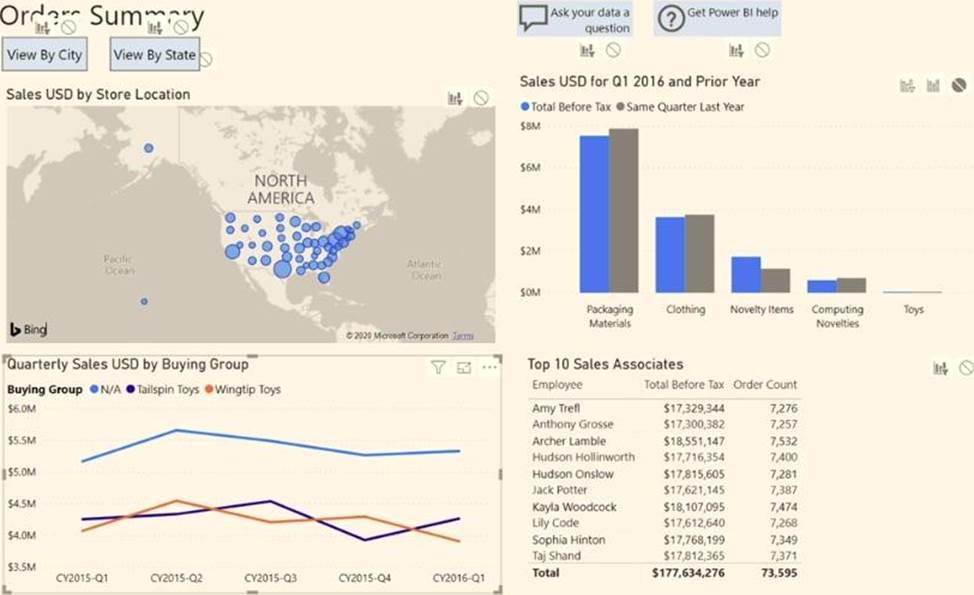
You have a report page that contains the visuals shown in the following exhibit.

Use the drop-down menus to select the answer choice that completes each statement based on the information presented in the graphic. NOTE: Each correct selection is worth one point.


Explanation:
Box 1: cross-filter
By default, selecting a data point in one visual on a report page will cross-filter or cross-highlight the other visuals on the page.
Box 2: cross-highlight
Example:
By default, selecting a data point in one visual on a report page will cross-filter or cross-highlight the other visuals on the page.

HOTSPOT
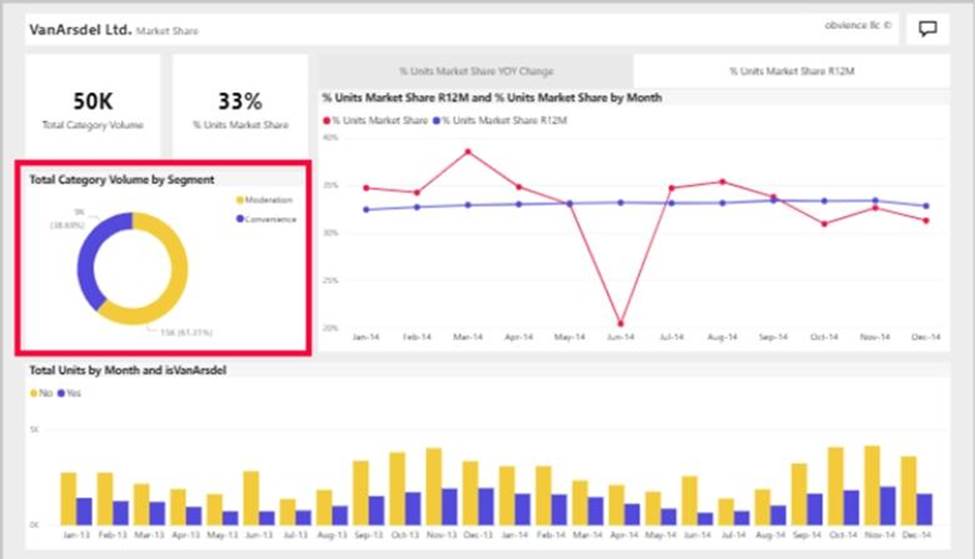
You have a report page that contains the visuals shown in the following exhibit.

Use the drop-down menus to select the answer choice that completes each statement based on the information presented in the graphic. NOTE: Each correct selection is worth one point.


Explanation:
Box 1: cross-filter
By default, selecting a data point in one visual on a report page will cross-filter or cross-highlight the other visuals on the page.
Box 2: cross-highlight
Example:
By default, selecting a data point in one visual on a report page will cross-filter or cross-highlight the other visuals on the page.

HOTSPOT
You have a report page that contains the visuals shown in the following exhibit.

Use the drop-down menus to select the answer choice that completes each statement based on the information presented in the graphic. NOTE: Each correct selection is worth one point.


Explanation:
Box 1: cross-filter
By default, selecting a data point in one visual on a report page will cross-filter or cross-highlight the other visuals on the page.
Box 2: cross-highlight
Example:
By default, selecting a data point in one visual on a report page will cross-filter or cross-highlight the other visuals on the page.

HOTSPOT
You have a report page that contains the visuals shown in the following exhibit.

Use the drop-down menus to select the answer choice that completes each statement based on the information presented in the graphic. NOTE: Each correct selection is worth one point.


Explanation:
Box 1: cross-filter
By default, selecting a data point in one visual on a report page will cross-filter or cross-highlight the other visuals on the page.
Box 2: cross-highlight
Example:
By default, selecting a data point in one visual on a report page will cross-filter or cross-highlight the other visuals on the page.

Latest PL-300 Dumps Valid Version with 131 Q&As
Latest And Valid Q&A | Instant Download | Once Fail, Full Refund

