Microsoft PL-300 Microsoft Power BI Data Analyst Online Training
Microsoft PL-300 Online Training
The questions for PL-300 were last updated at Feb 22,2026.
- Exam Code: PL-300
- Exam Name: Microsoft Power BI Data Analyst
- Certification Provider: Microsoft
- Latest update: Feb 22,2026
HOTSPOT
You need to create a visual as shown in the following exhibit.
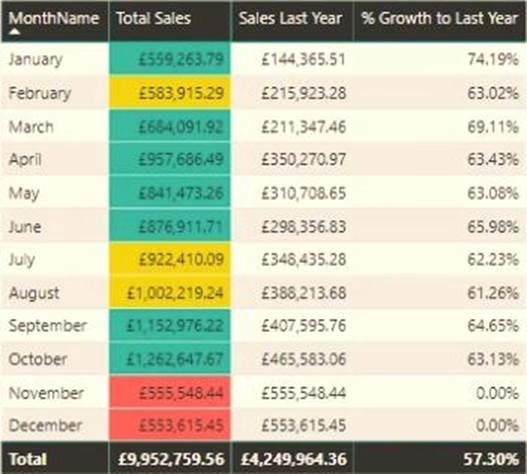
The indicator color for Total Sales will be based on % Growth to Last Year.
The solution must use the existing calculations only.
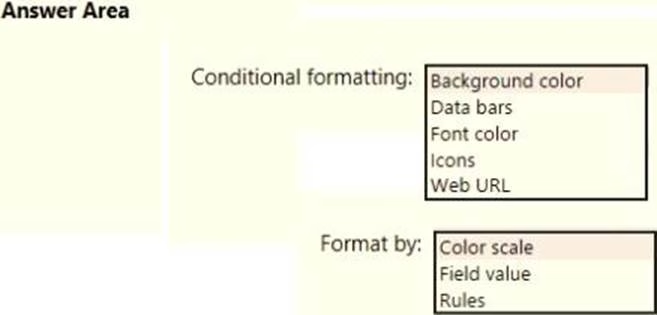
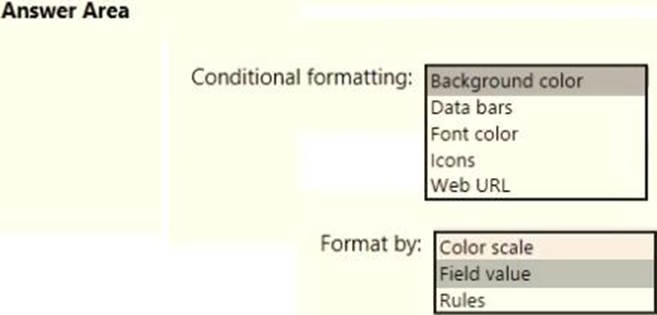
How should you configure the visual? To answer, select the appropriate options in the answer area. NOTE: Each correct selection is worth one point.
HOTSPOT
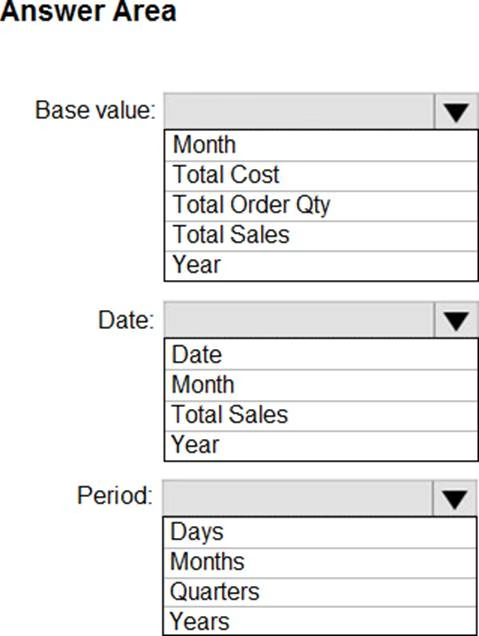
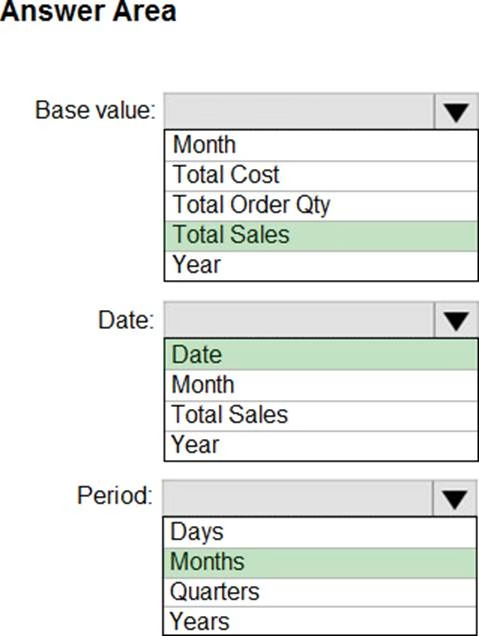
You are creating a quick measure as shown in the following exhibit.
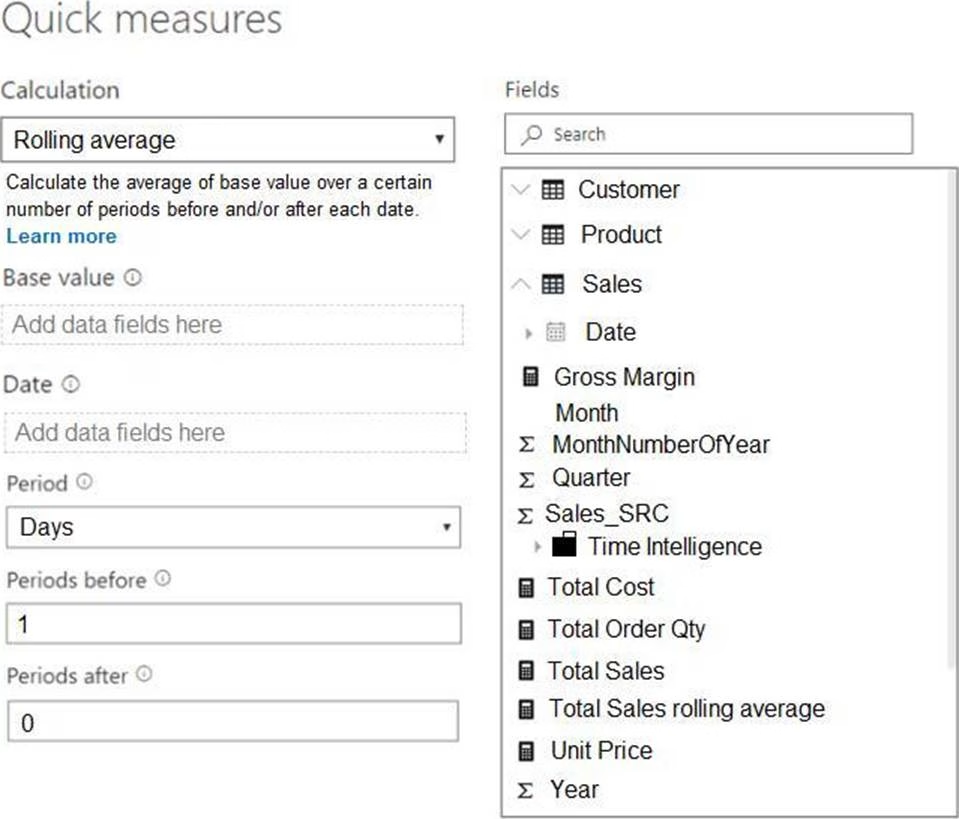
You need to create a monthly rolling average measure for Sales over time.
How should you configure the quick measure calculation? To answer, select the appropriate options in the answer area. NOTE: Each correct selection is worth one point.
You have a data model that contains many complex DAX expressions. The expressions contain frequent references to the RELATED and RELATEDTABLE functions.
You need to recommend a solution to minimize the use of the RELATED and RELATEDTABLE functions.
What should you recommend?
- A . Merge tables by using Power Query.
- B . Hide unused columns in the model.
- C . Split the model into multiple models.
- D . Transpose.
You have a sales system that contains the tables shown in the following table.
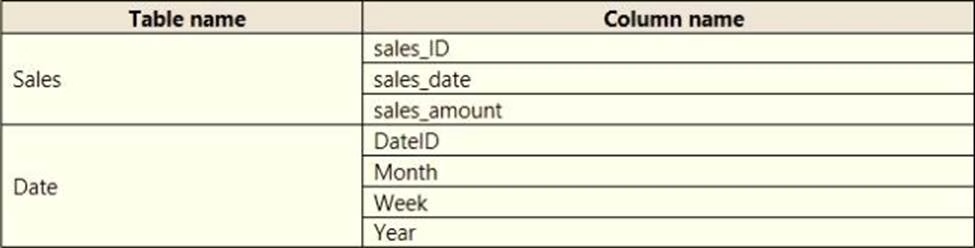
The Date table is marked as a date table.
DatelD is the date data type. You need to create an annual sales growth percentage measure.
Which DAX expression should you use?
- A . SUM(sales[sales_amount]) – CALCULATE(SUM(sales[sales_amount]), SAMEPERIODLASTYEAR(‘Date'[DateID])
- B . (SUM(‘Sales’[sales_amount]) – CALCULATE(SUM(‘Sales’[sales_amount]), SAMEPERIODLASTYEAR(‘Date’[DateID])))
/ CALCULATE(SUM(‘Sales’[sales_amount]), SAMEPERIODLASTYEAR(‘Date’[DateID])) - C . CALCULATE(SUM(sales[sales_amount]), DATESYTD(‘Date’[DateID]))
- D . CALCULATE(SUM(sales[sales_amount]), SAMEPERIODLASTYEAR(‘Date’[DateID]))
You build a report to analyze customer transactions from a database that contains the tables shown in the following table.
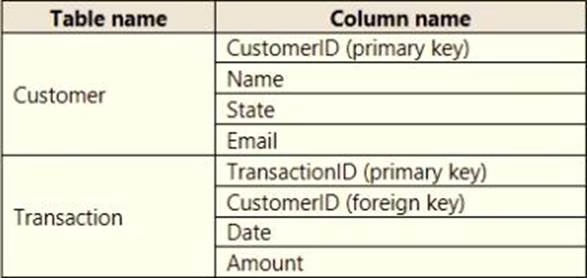
You import the tables.
Which relationship should you use to link the tables?
- A . one-to-many from Customer to Transaction
- B . one-to-one between Customer and Transaction
- C . one-to-many from Transaction to Customer
- D . many-to-many between Customer and Transaction
HOTSPOT
You are creating an analytics report that will consume data from the tables shown in the following table.
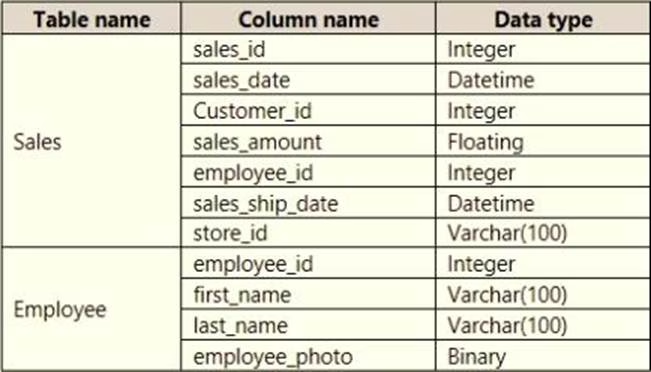
There is a relationship between the tables.
There are no reporting requirements on employeejd and employee_photo.
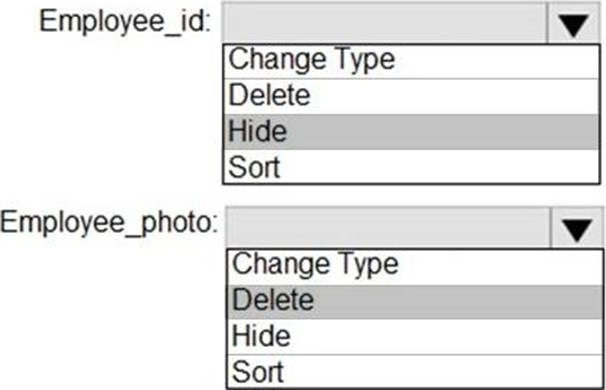
You need to optimize the data model
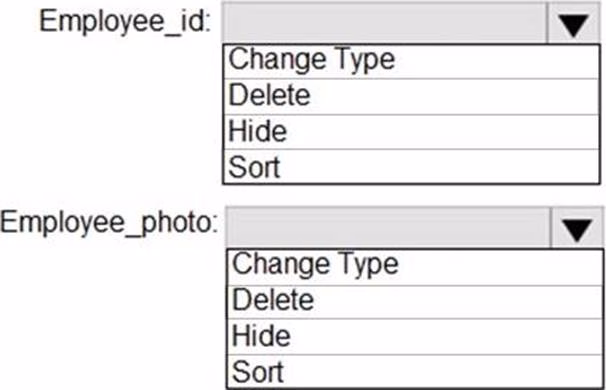
What should you configure for employeejd and employee.photo? To answer, select the appropriate options in the answer area.
HOTSPOT
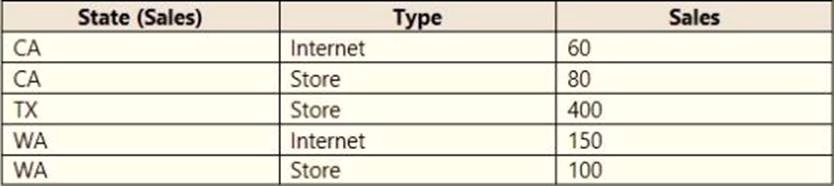
You are creating a Microsoft Power Bl model that has two tables named CityData and Sales.
CityData contains only the data shown in the following table.
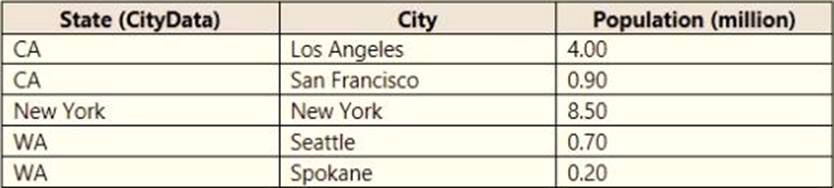
Sales contains only the data shown in the following table.
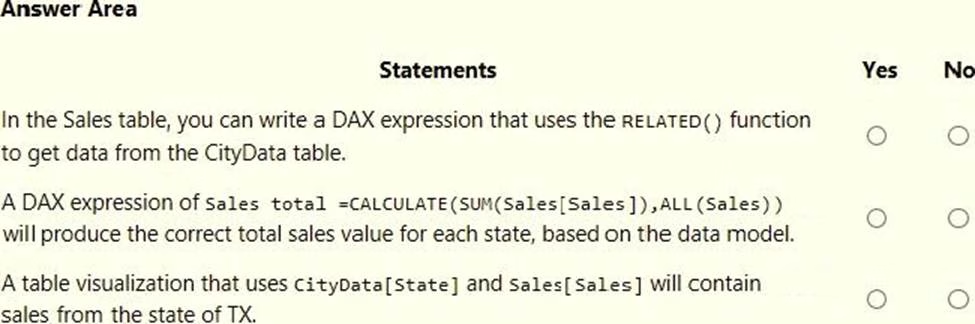
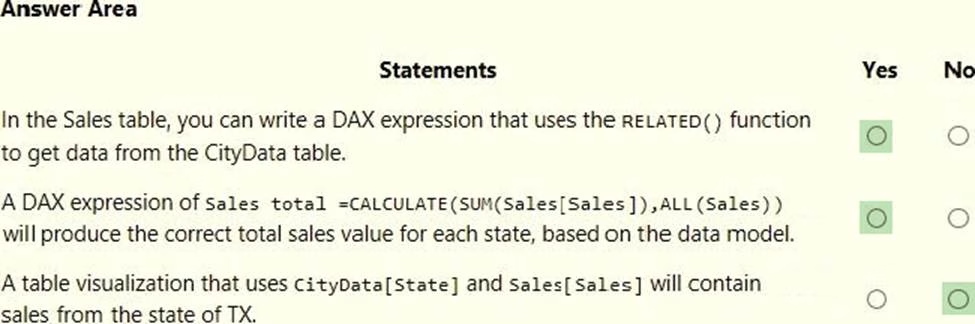
For each of the following statements, select Yes if the statement is true. Otherwise, select No. NOTE: Each correct selection is worth one point.
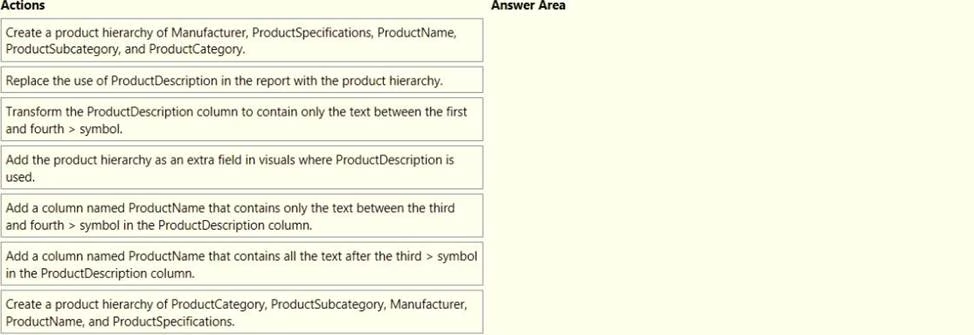
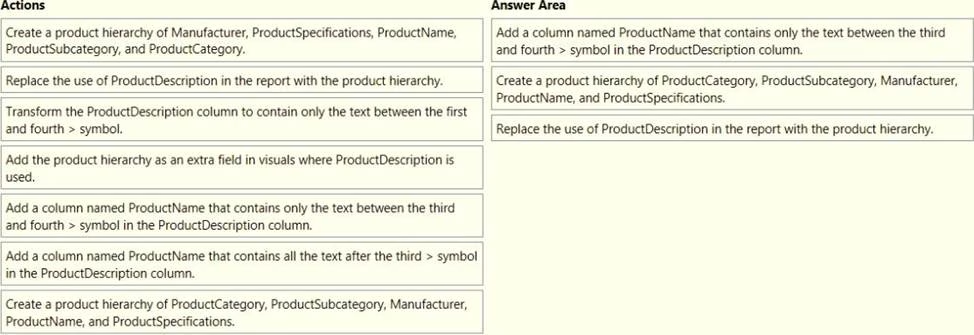
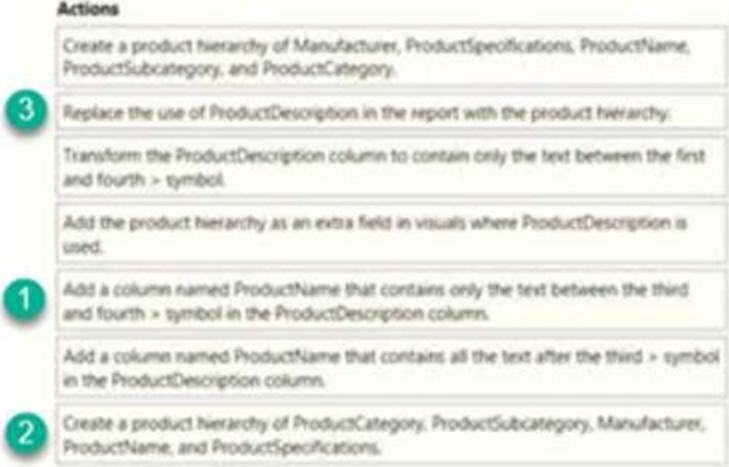
DRAG DROP
You build a report about warehouse inventory data. The dataset has more than 10 million product records from 200 warehouses worldwide.
You have a table named Products that contains the columns shown in the following table.
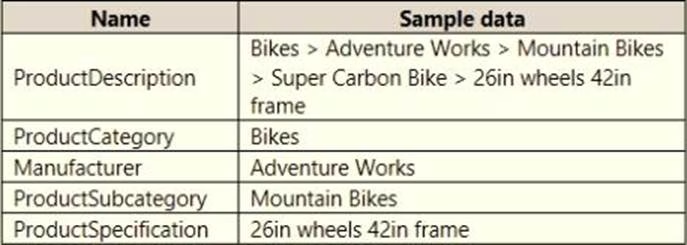
Warehouse managers report that it is difficult to use the report because the report uses only the product name in tables and visuals. The product name is contained within the ProductDescription column and is always the fourth value.
You need to modify the report to support the warehouse managers requirement to explore inventory levels at different levels of the product hierarchy. The solution must minimize the model size.
Which three actions should you perform in sequence? To answer, move the appropriate actions from the list of actions to the answer area and arrange them in the correct order.
HOTSPOT
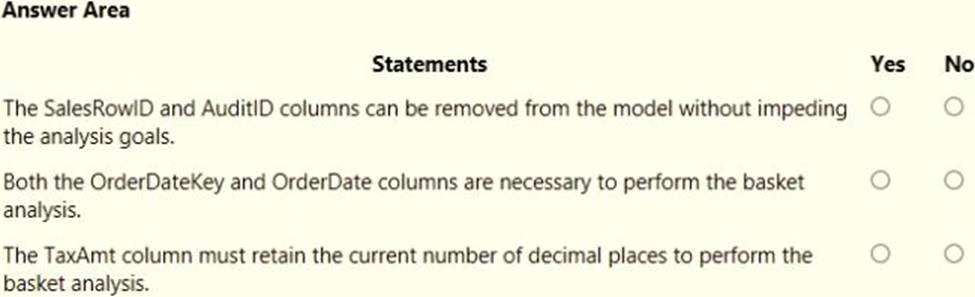
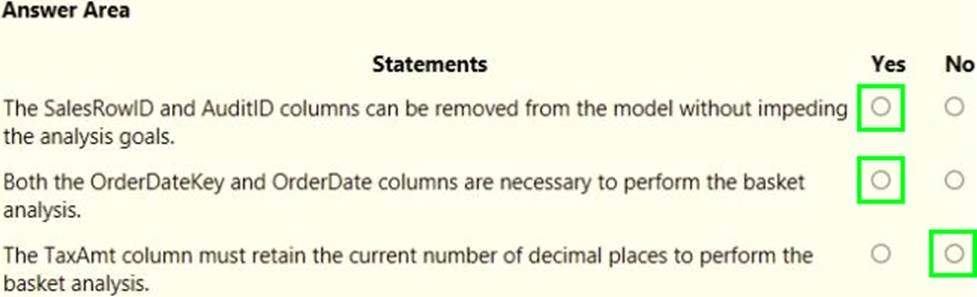
You are creating a Microsoft Power Bl imported data model to perform basket analysis. The goal of the analysis is to identify which products are usually bought together in the same transaction across and within sales territories.
You import a fact table named Sales as shown in the exhibit. (Click the Exhibit tab.)
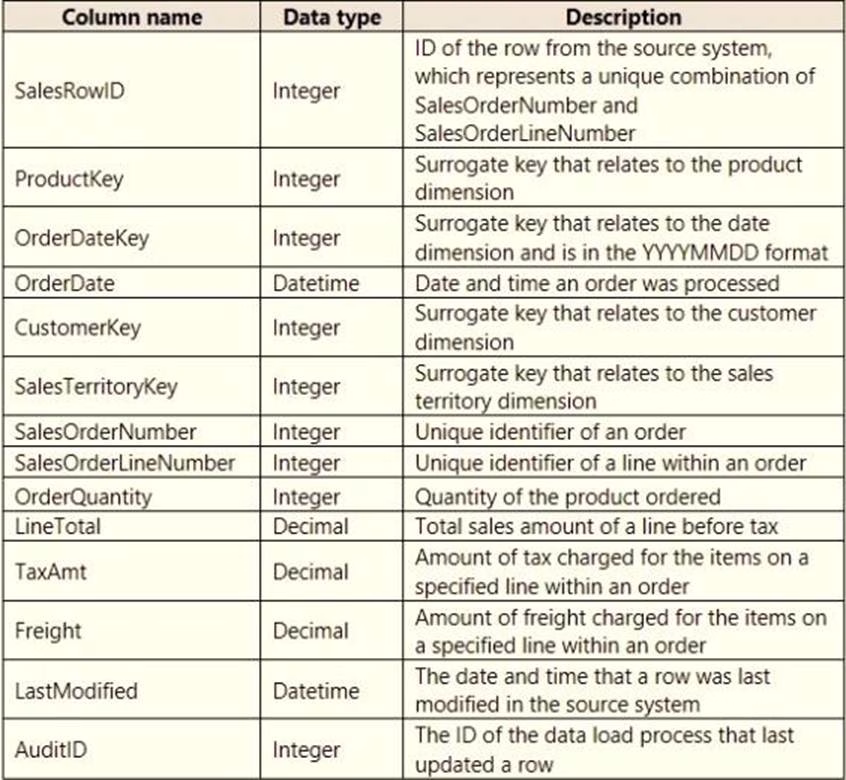
The related dimension tables are imported into the model.
For each of the following statements, select Yes if the statement is true. Otherwise, select No. NOTE: Each correct selection is worth one point.
You are configuring a Microsoft Power Bl data model to enable users to ask natural language questions by using Q&A. You have a table named Customer that has the following measure.
Customer Count = DISTINCTCOUNT(Customer[CustomerID])
Users frequently refer to customers as subscribers.
You need to ensure that the users can get a useful result for "subscriber count" by using Q&A. The solution must minimize the size of the model.
What should you do?
- A . Add a description of "subscriber count" to the Customer Count measure.
- B . Set Summarize By to None for the CustomerlD column.
- C . Add a description of "Subscriber" to the Customer table.
- D . Add a synonym of "subscriber" to the Customer table.
Latest PL-300 Dumps Valid Version with 131 Q&As
Latest And Valid Q&A | Instant Download | Once Fail, Full Refund
