Microsoft PL-300 Microsoft Power BI Data Analyst Online Training
Microsoft PL-300 Online Training
The questions for PL-300 were last updated at Dec 28,2025.
- Exam Code: PL-300
- Exam Name: Microsoft Power BI Data Analyst
- Certification Provider: Microsoft
- Latest update: Dec 28,2025
You have a CSV file that contains user complaints. The file contains a column named Logged. Logged
contains the date and time each compliant occurred. The data in Logged is in the following format:
2018-12-31 at 08:59.
You need to be able to analyze the complaints by the logged date and use a built-in date hierarchy.
What should you do?
- A . Change the data type of the Logged column to Date.
- B . Apply a transform to extract the last 11 characters of the Logged column and set the data type of the new column to Date.
- C . Create a column by example that starts with 2018-12-31 and set the data type of the new column to Date.
- D . Apply a transform to extract the first 11 characters of the Logged column.
You have an Azure SQL database that contains sales transactions. The database is updated frequently.
You need to generate reports from the data to detect fraudulent transactions. The data must be visible within five minutes of an update.
How should you configure the data connection?
- A . Add a SQL statement.
- B . Set Data Connectivity mode to DirectQuery.
- C . Set the Command timeout in minutes setting.
- D . Set Data Connectivity mode to Import.
You have a Microsoft Power BI data model that contains three tables named Orders, Date, and City.
There is a one-to-many relationship between Date and Orders and between City and Orders.
The model contains two row-level security (RLS) roles named Role1 and Role2.
Role1 contains the following filter.
City[State Province] = "Kentucky"
Role2 contains the following filter.
Date[Calendar Year] = 2020
If a user is a member of both Role1 and Role2, what data will they see in a report that uses the model?
- A . The user will see data for which the State Province value is Kentucky and the Calendar Year is 2020.
- B . The user will see data for which the State Province value is Kentucky or the Calendar Year is 2020.
- C . The user will see only data for which the State Province value is Kentucky.
- D . The user will receive an error and will not be able to see the data in the report.
HOTSPOT
Your company has affiliates who help the company acquire customers.
You build a report for the affiliate managers at the company to assist them in understanding affiliate performance.
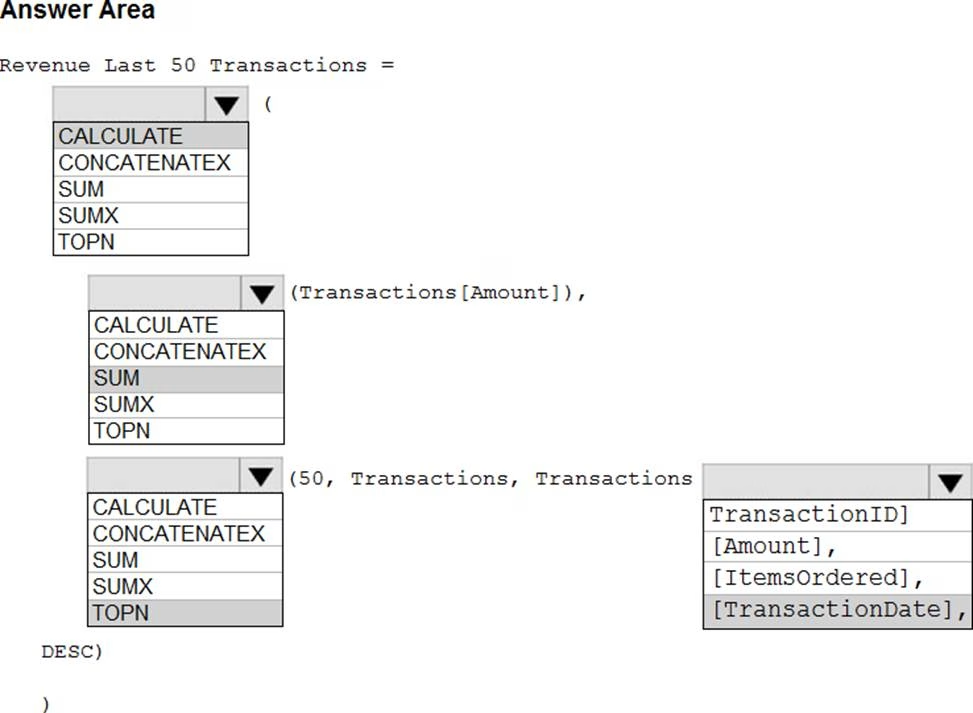
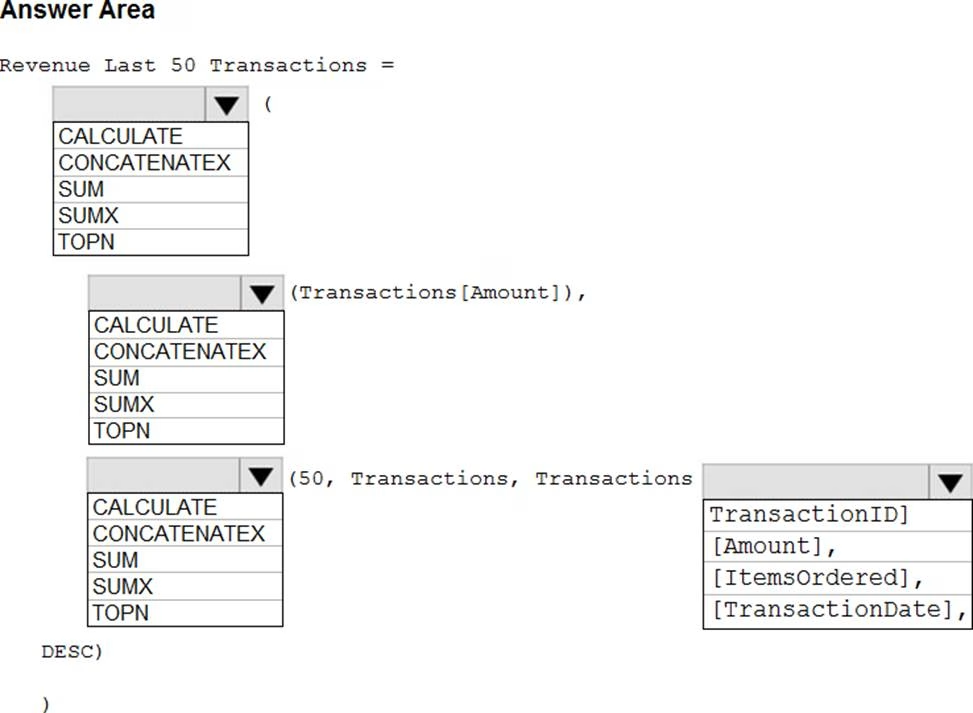
The managers request a visual showing the total sales value of the latest 50 transactions for each affiliate. You have a data model that contains the following tables.

You need to develop a measure to support the visual.
How should you complete the DAX expression? To answer, select the appropriate options in the answer area. NOTE: Each correct selection is worth one point.
HOTSPOT
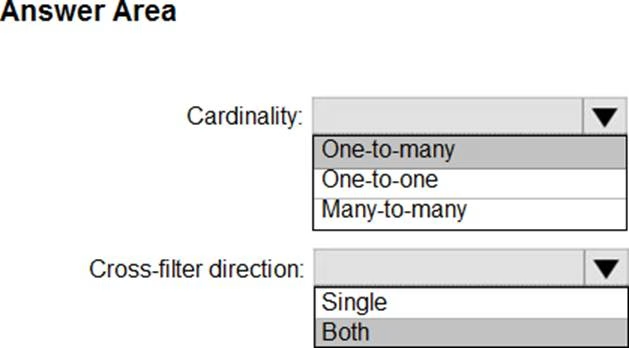
You are creating a Microsoft Power BI data model that has the tables shown in the following table.
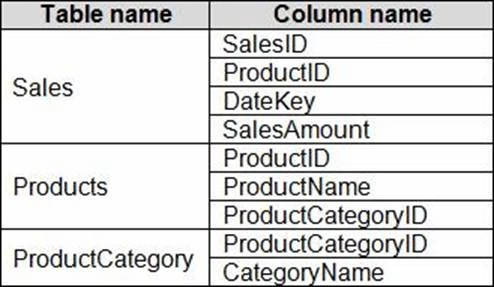
The Products table is related to the ProductCategory table through the ProductCategoryID column.
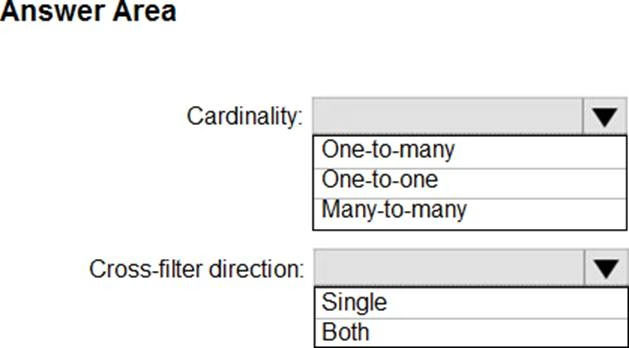
You need to ensure that you can analyze sales by product category.
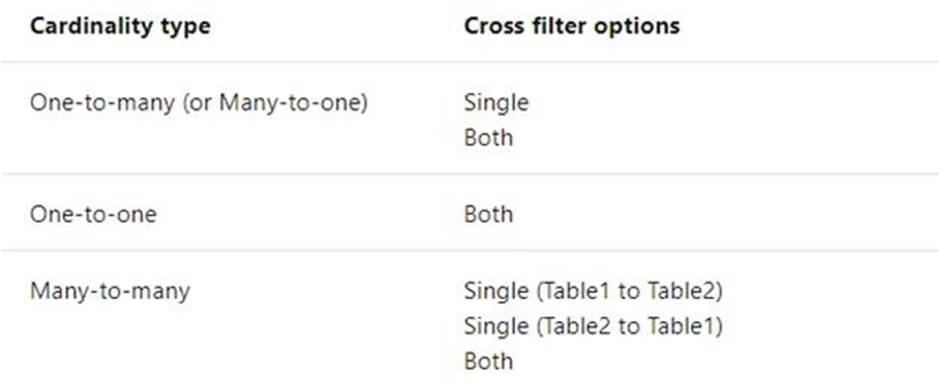
How should you configure the relationships from Products to ProductCategory? To answer, select the appropriate options in the answer area. NOTE: Each correct selection is worth one point.
DRAG DROP
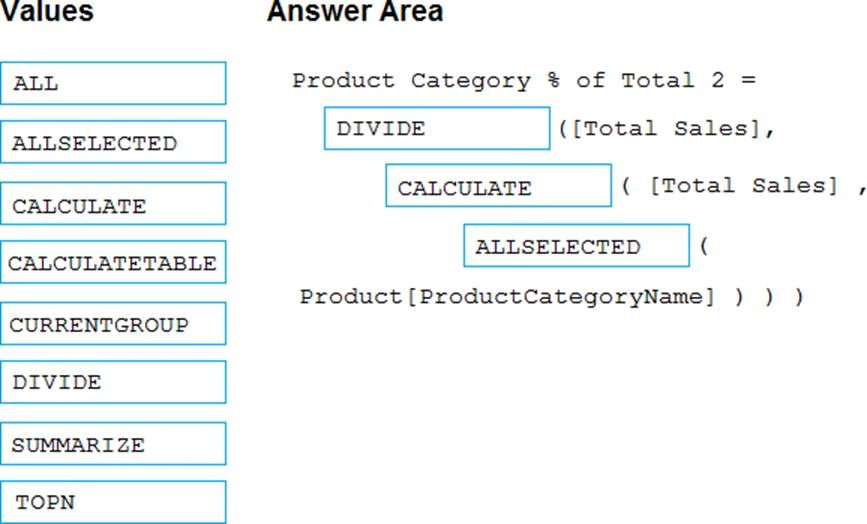
You have a Microsoft Power BI data model that contains three tables named Sales, Product, and Date.
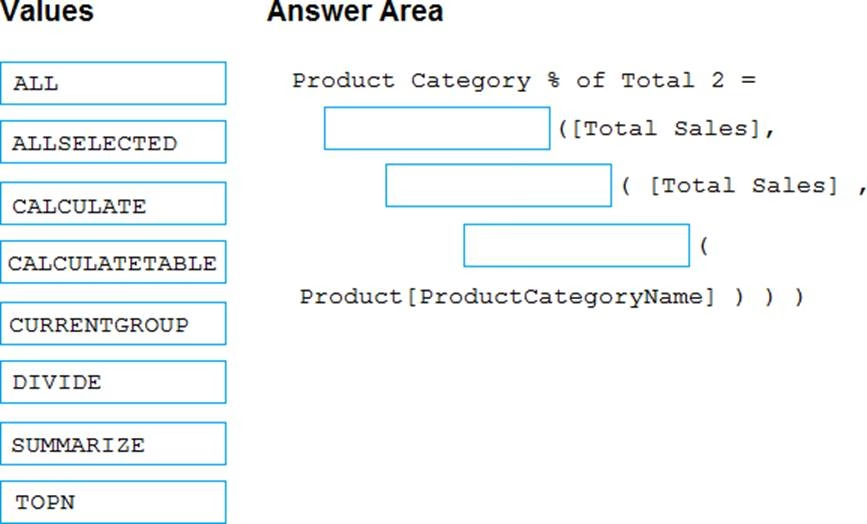
The Sales table has an existing measure named [Total Sales] that sums the total sales from the Sales table.
You need to write a calculation that returns the percentage of total sales that a selected ProductCategoryName value represents. The calculation must respect any slicers on ProductCategoryName and must show the percentage of visible total sales. For example, if there are four ProductCategoryName values, and a user filters one out, a table showing ProductCategoryName and the calculation must sum up to 100 percent.
How should you complete the calculation? To answer, drag the appropriate values to the correct targets. Each value may be used once, more than once, or not at all. You may need to drag the split bar between panes or scroll to view content. NOTE: Each correct selection is worth one point.
You have sales data in a star schema that contains four tables named Sales, Customer, Date, and Product.
The Sales table contains purchase and ship dates.
Most often, you will use the purchase date to analyze the data, but you will analyze the data by both dates independently and together.
You need to design an imported dataset to support the analysis. The solution must minimize the model size and the number of queries against the data source.
Which data modeling design should you use?
- A . Use the Auto Date/Time functionality in Microsoft Power BI and do NOT import the Date table.
- B . Duplicate the Date query in Power Query and use active relationships between both Date tables.
- C . On the Date table, use a reference query in Power Query and create active relationships between Sales and both Date tables in the modeling view.
- D . Create an active relationship between Sales and Date for the purchase date and an inactive relationship for the ship date.
Note: This question is part of a series of questions that present the same scenario. Each question in the series contains a unique solution that might meet the stated goals. Some question sets might have more than one correct solution, while others might not have a correct solution.
After you answer a question in this scenario, you will NOT be able to return to it. As a result, these questions will not appear in the review screen.
You have a clustered bar chart that contains a measure named Salary as the value and a field named Employee as the axis. Salary is present in the data as numerical amount representing US dollars.
You need to create a reference line to show which employees are above the median salary.
Solution: You create a constant line and set the value to .5.
Does this meet the goal?
- A . Yes
- B . No
Latest PL-300 Dumps Valid Version with 131 Q&As
Latest And Valid Q&A | Instant Download | Once Fail, Full Refund

