Microsoft DA-100 Analyzing Data with Microsoft Power BI Online Training
Microsoft DA-100 Online Training
The questions for DA-100 were last updated at Dec 25,2025.
- Exam Code: DA-100
- Exam Name: Analyzing Data with Microsoft Power BI
- Certification Provider: Microsoft
- Latest update: Dec 25,2025
DRAG DROP
You build a report about warehouse inventory data. The dataset has more than 10 million product records from 200 warehouses worldwide.
You have a table named Products that contains the columns shown in the following table.
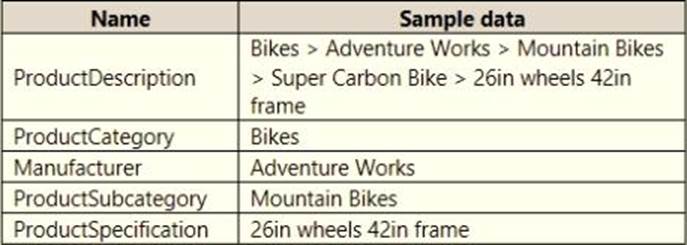
Warehouse managers report that it is difficult to use the report because the report uses only the product name in tables and visuals. The product name is contained within the ProductDescription column and is always the fourth value.
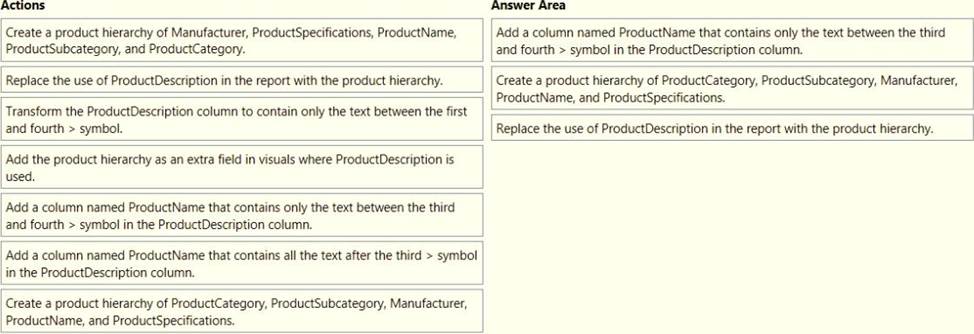
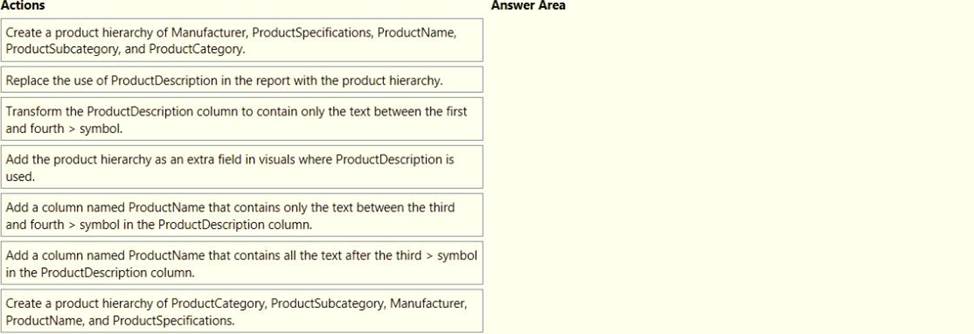
You need to modify the report to support the warehouse managers requirement to explore inventory levels at different levels of the product hierarchy. The solution must minimize the model size.
Which three actions should you perform in sequence? To answer, move the appropriate actions from the list of actions to the answer area and arrange them in the correct order.
DRAG DROP
You have a Microsoft Power BI data model that contains three tables named Sales, Product, and Date.
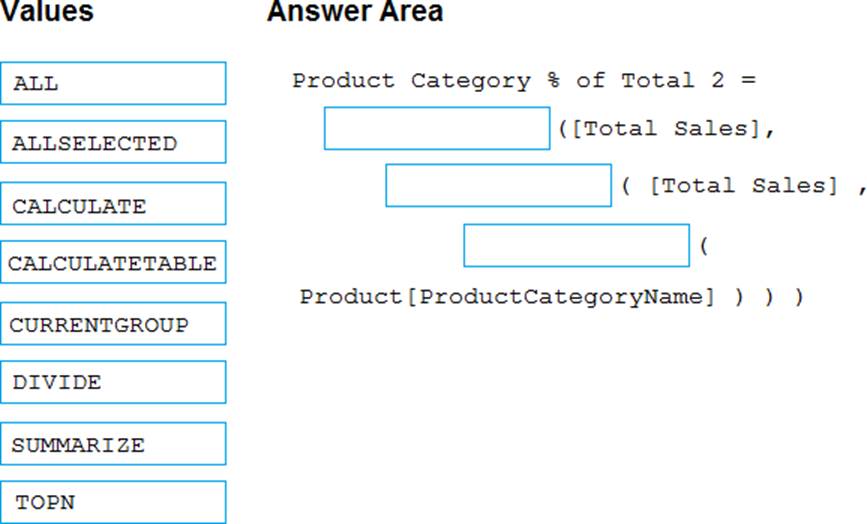
The Sales table has an existing measure named [Total Sales] that sums the total sales from the Sales table.
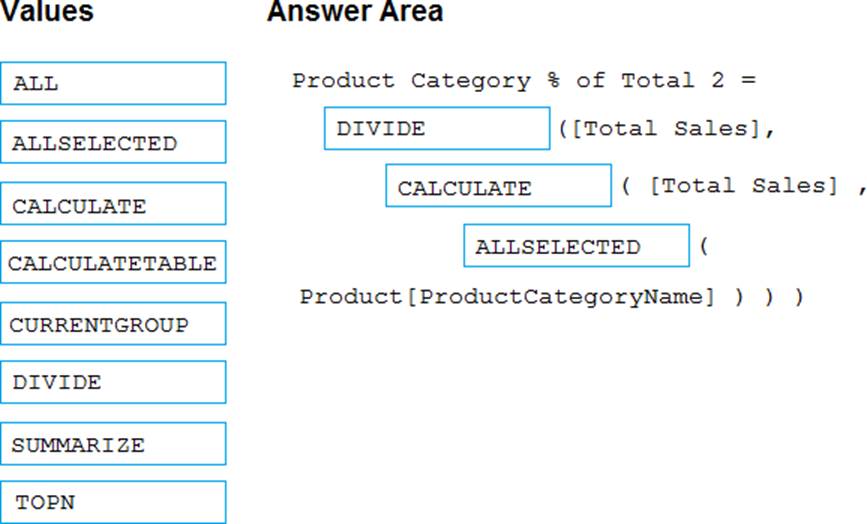
You need to write a calculation that returns the percentage of total sales that a selected ProductCategoryName value represents. The calculation must respect any slicers on ProductCategoryName and must show the percentage of visible total sales. For example, if there are four ProductCategoryName values, and a user filters one out, a table showing ProductCategoryName and the calculation must sum up to 100 percent.
How should you complete the calculation? To answer, drag the appropriate values to the correct targets. Each value may be used once, more than once, or not at all. You may need to drag the split bar between panes or scroll to view content. NOTE: Each correct selection is worth one point.
HOTSPOT
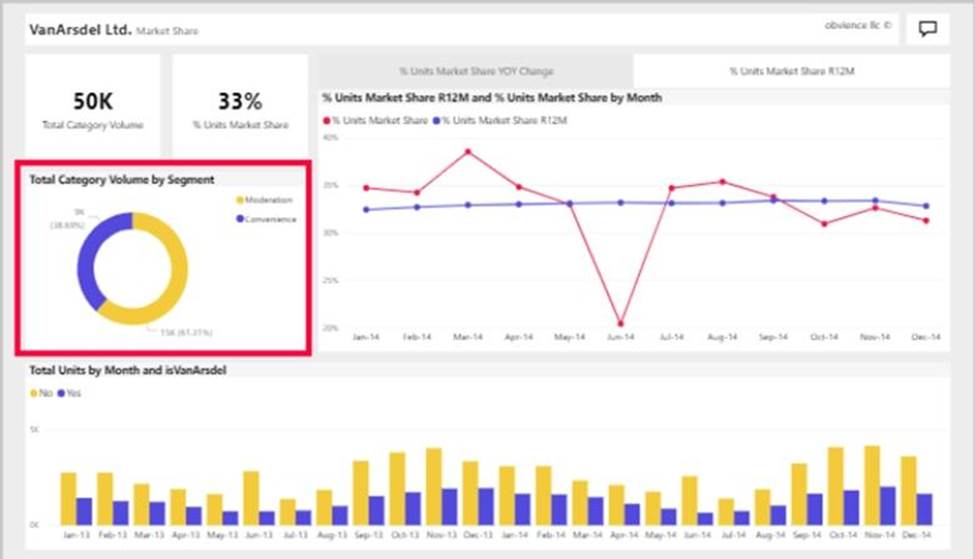
You have a report page that contains the visuals shown in the following exhibit.
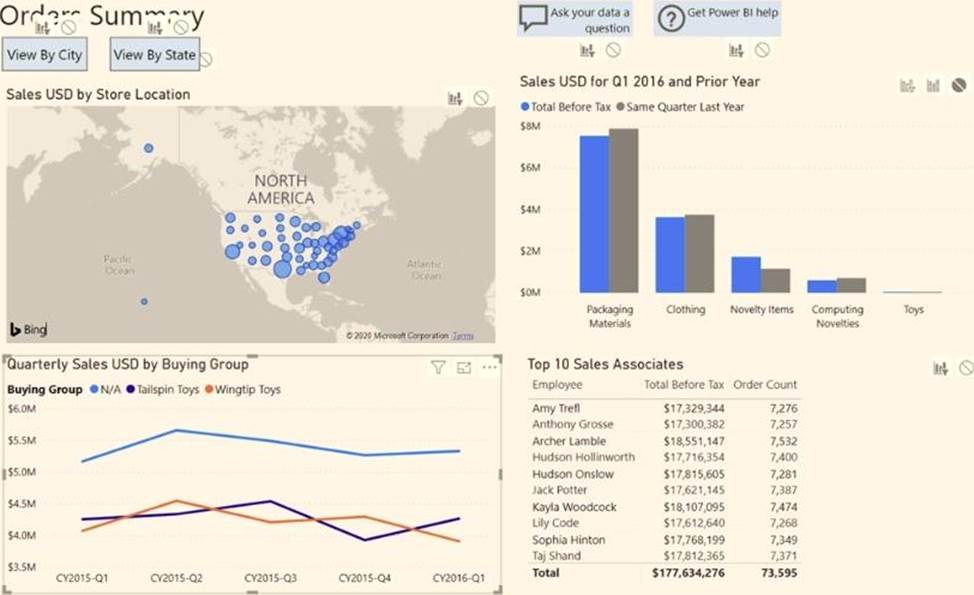
Use the drop-down menus to select the answer choice that completes each statement
based on the information presented in the graphic. NOTE: Each correct selection is worth one point.

HOTSPOT
You have a report page that contains the visuals shown in the following exhibit.

Use the drop-down menus to select the answer choice that completes each statement
based on the information presented in the graphic. NOTE: Each correct selection is worth one point.

HOTSPOT
You have a report page that contains the visuals shown in the following exhibit.

Use the drop-down menus to select the answer choice that completes each statement
based on the information presented in the graphic. NOTE: Each correct selection is worth one point.

HOTSPOT
You have a report page that contains the visuals shown in the following exhibit.

Use the drop-down menus to select the answer choice that completes each statement
based on the information presented in the graphic. NOTE: Each correct selection is worth one point.

Note: This question is part of a series of questions that present the same scenario. Each question in the series contains a unique solution that might meet the stated goals. Some question sets might have more than one correct solution, while others might not have a correct solution.
After you answer a question in this section, you will NOT be able to return to it. As a result, these questions will not appear in the review screen,
You create a parameter named DataSourceExcel that holds the file name and location of a Microsoft Excel data source.
You need to update the query to reference the parameter instead of multiple hard-coded copies of the location within each query definition.
Solution: In the Power Query M code, you replace references to the Excel file with DataSourceExcel.
Does this meet the goal?
- A . Yes
- B . No
You have a Microsoft Power BI report. The size of PBIX file is 550 MB. The report is accessed by using an App workspace in shared capacity of powerbi.com.
The report uses an imported dataset that contains one fact table. The fact table contains 12 million rows. The dataset is scheduled to refresh twice a day at 08:00 and 17:00.
The report is a single page that contains 15 AppSource visuals and 10 default visuals.
Users say that the report is slow to load the visuals when they access and interact with the report.
You need to recommend a solution to improve the performance of the report.
What should you recommend?
- A . Change any DAX measures to use iterator functions.
- B . Replace the default visuals with AppSource visuals.
- C . Change the imported dataset to DirectQuery.
- D . Remove unused columns from tables in the data model.
Note: This question is part of a series of questions that present the same scenario. Each question in the series contains a unique solution that might meet the stated goals. Some question sets might have more than one correct solution, while others might not have a correct solution.
After you answer a question in this scenario, you will NOT be able to return to it. As a result, these questions will not appear in the review screen.
You have a clustered bar chart that contains a measure named Salary as the value and a field named Employee as the axis. Salary is present in the data as numerical amount representing US dollars.
You need to create a reference line to show which employees are above the median salary.
Solution: You create a percentile line by using the Salary measure and set the percentile to 50%.
Does this meet the goal?
- A . Yes
- B . No
You open a query in Power Query Editor.
You need to identify the percentage of empty values in each column as quickly as possible.
Which Data Preview option should you select?
- A . Show whitespace
- B . Column profile
- C . Column distribution
- D . Column quality
Latest DA-100 Dumps Valid Version with 114 Q&As
Latest And Valid Q&A | Instant Download | Once Fail, Full Refund

