Microsoft DA-100 Analyzing Data with Microsoft Power BI Online Training
Microsoft DA-100 Online Training
The questions for DA-100 were last updated at Dec 15,2025.
- Exam Code: DA-100
- Exam Name: Analyzing Data with Microsoft Power BI
- Certification Provider: Microsoft
- Latest update: Dec 15,2025
You have a prospective customer list that contains 1,500 rows of data.
The list contains the following fields:
✑ First name
✑ Last name
✑ Email address
✑ State/Region
✑ Phone number
You import the list into Power Query Editor.
You need to ensure that the list contains records for each State/Region to which you want to target a marketing campaign.
Which two actions should you perform? Each correct answer presents part of the solution. NOTE: Each correct selection is worth one point.
- A . Open the Advanced Editor.
- B . Select Column quality.
- C . Enable Column profiling based on entire dataset.
- D . Select Column distribution.
- E . Select Column profile.
Your company has employees in 10 states.
The company recently decided to associate each state to one of the following three regions: East, West, and North.
You have a data model that contains employee information by state. The model does NOT include region
information.
You have a report that shows the employees by state.
You need to view the employees by region as quickly as possible.
What should you do?
- A . Create a new aggregation that summarizes by employee.
- B . Create a new group on the state column and set the Group type to List.
- C . Create a new group on the state column and set the Group type to Bin.
- D . Create a new aggregation that summarizes by state.
You have the visual shown in the Original exhibit. {Click the Original tab.)
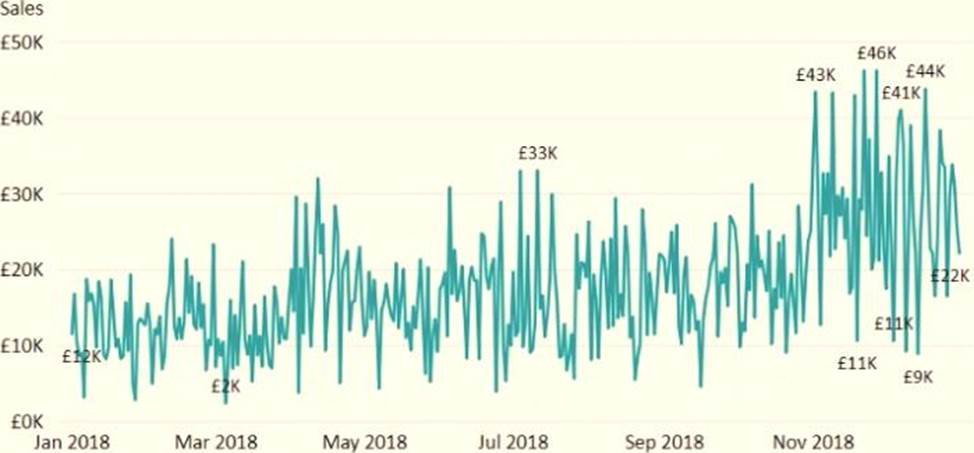
You need to configure the visual as shown in the Modified exhibit. (Click the Modified tab.)
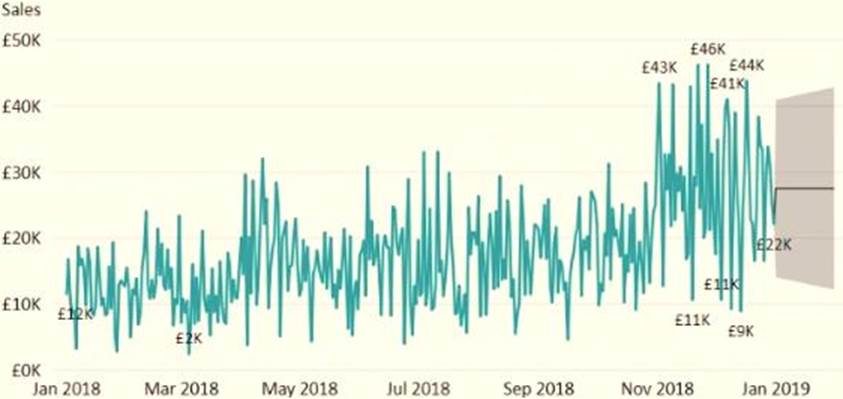
What should you add to the visual?
- A . a measure
- B . a trendline
- C . a forecast
- D . an Average line
You have the dataset shown in the following exhibit.
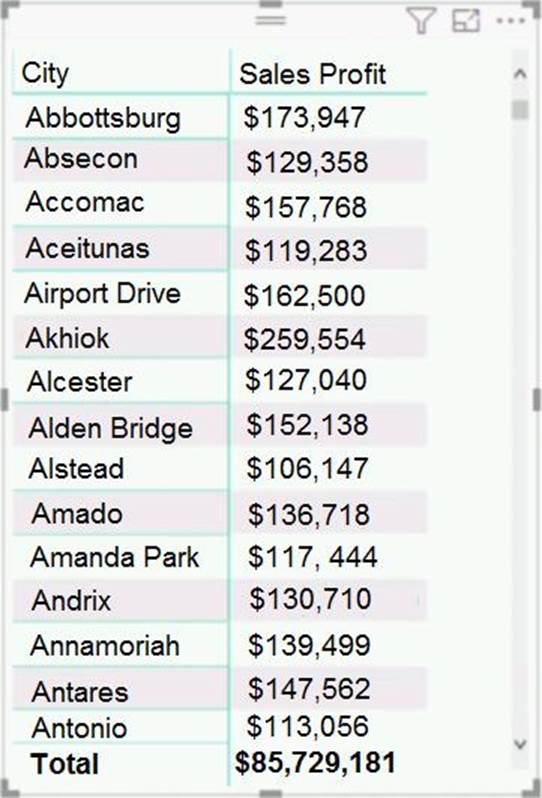
You need to ensure that the visual shows only the 10 cities that have the highest sales profit.
What should you do?
- A . Add a Top N filter to the visual.
- B . Configure the Sales Profit measure to use the RANKX function.
- C . Add a calculated column to the table that uses the TOPN function. In the visual, replace Sales Profit with the calculated column.
- D . Add a calculated column to the table that returns the city name if the city is in the top 10, otherwise the
calculated column will return "Not in Top 10". In the visual, replace Sales Profit with the calculated column.
Note: This question is part of a series of questions that present the same scenario. Each question in the series contains a unique solution that might meet the stated goals. Some question sets might have more than one correct solution, while others might not have a correct solution.
After you answer a question in this scenario, you will NOT be able to return to it. As a result, these questions will not appear in the review screen.
You have a clustered bar chart that contains a measure named Salary as the value and a field named Employee as the axis. Salary is present in the data as numerical amount representing US dollars.
You need to create a reference line to show which employees are above the median
salary.
Solution: You create a constant line and set the value to .5.
Does this meet the goal?
- A . Yes
- B . No
You have a report that contains three pages. One of the pages contains a KPI visualization. You need to filter all the visualizations in the report except for the KPI visualization .
Which two actions should you perform? Each correct answer presents part of the solution. NOTE: Each correct selection is worth one point.
- A . Add the same slicer to each page and configure Sync slicers.
- B . Edit the interactions of the KPI visualization.
- C . Configure a page-level filter.
- D . Edit the interactions of the slicer that is on the same page as the KPI visualization.
- E . Configure a report-level filter.
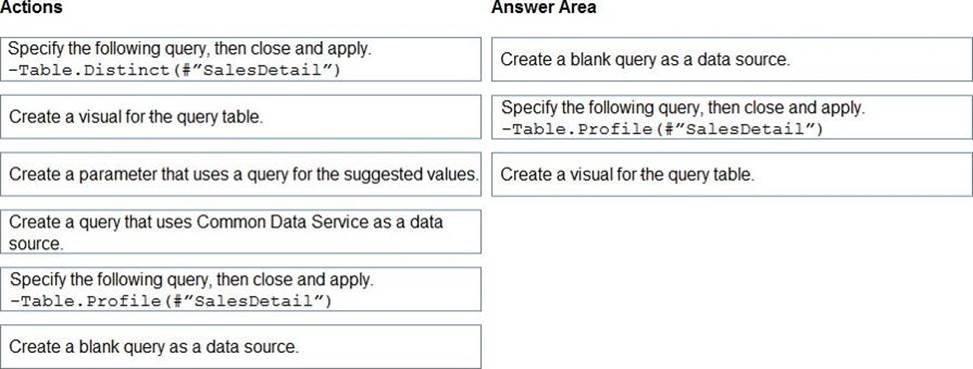
DRAG DROP
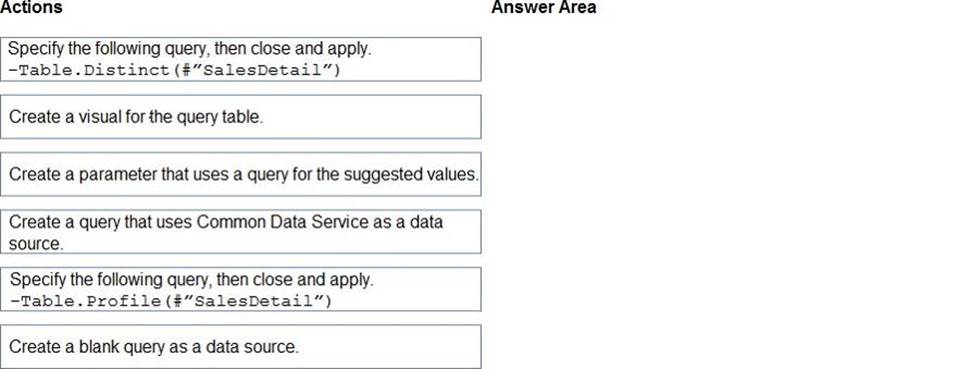
You are modeling data in table named SalesDetail by using Microsoft Power Bl.
You need to provide end users with access to the summary statistics about the SalesDetail data. The users require insights on the completeness of the data and the value distributions.
Which three actions should you perform in sequence? To answer, move the appropriate actions from the list of actions to the answer area and arrange them in the correct order.
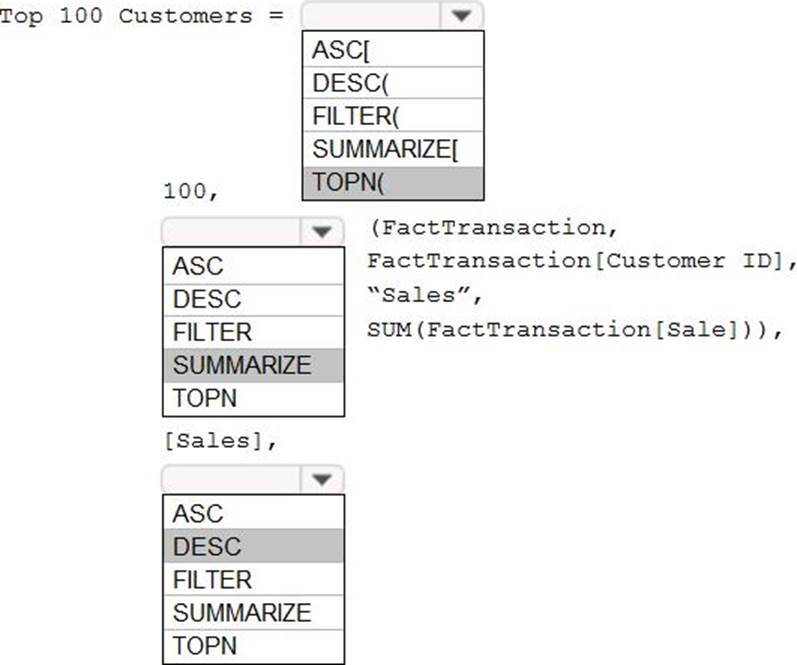
HOTSPOT
You have a Power BI report.
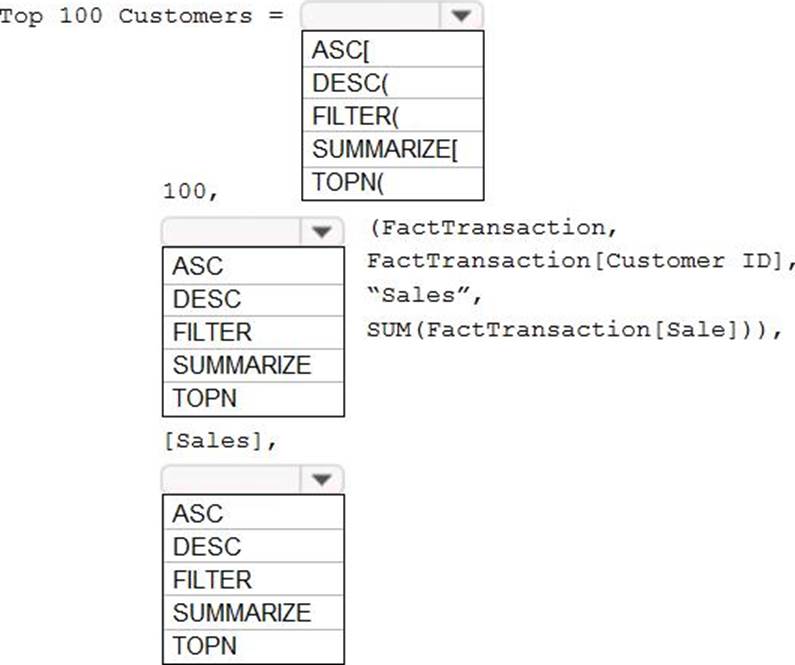
You need to create a calculated table to return the 100 highest spending customers.
How should you complete the DAX expression? To answer, select the appropriate options in the answer area. NOTE: Each correct selection is worth one point.
You have a table that contains sales data and approximately 1,000 rows.
You need to identify outliers in the table .
Which type of visualization should you use?
- A . area chart
- B . donut chart
- C . scatter plot
- D . pie chart
You have a collection of reports for the HR department of your company. The datasets use row-level security (RLS). The company has multiple sales regions that each has an HR manager. You need to ensure that the HR managers can interact with the data from their region only. The HR managers must be prevented from changing the layout of the reports .
How should you provision access to the reports for the HR managers?
- A . Create a new workspace, copy the datasets and reports, and add the HR managers as members of the workspace.
- B . Publish the reports to a different workspace other than the one hosting the datasets.
- C . Publish the reports in an app and grant the HR managers access permission.
- D . Add the HR managers as members of the existing workspace that hosts the reports and the datasets.
Latest DA-100 Dumps Valid Version with 114 Q&As
Latest And Valid Q&A | Instant Download | Once Fail, Full Refund

