Microsoft 70-778 Analyzing and Visualizing Data with Microsoft Power BI Online Training
Microsoft 70-778 Online Training
The questions for 70-778 were last updated at May 06,2025.
- Exam Code: 70-778
- Exam Name: Analyzing and Visualizing Data with Microsoft Power BI
- Certification Provider: Microsoft
- Latest update: May 06,2025
Note: This question is a part of a series of questions that present the same scenario. For your convenience, the scenario is repeated in each question. Each question presents a different goal and answer choices, but the text of the scenario is exactly the same in each question in this series.
Start of repeated scenario
You have a Microsoft SQL Server database that contains the following tables.
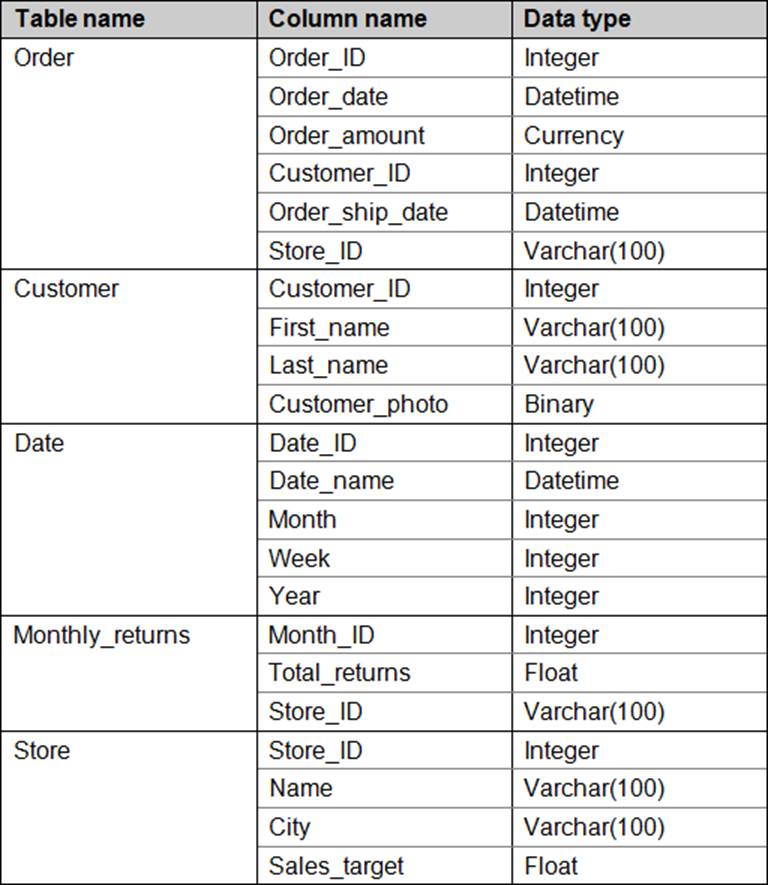
The following columns contain data information:
– Date[Month] in the mmyyyy format
– Date[Date_ID] in the ddmmyyyy format
– Date[Date_name] in the mm/dd/yyyy format
– Monthly_returns[Month_ID] in the mmyyyy format
The Order table contains more than one million rows.
The Store table has relationship to the Monthly_returns table on the Store_ID column. This is the only relationship between the tables.
You plan to use Power BI desktop to create an analytics solution for the data.
End of repeated scenario.
You are modifying the model to report on the number of order.
You need to calculate the number of orders.
What should you do?
- A . Create a calculated measure that uses the COUNTA(Order_ID) DAX formula.
- B . Create a calculated measure that uses the SUM (Order_ID) DAX formula.
- C . Create a calculated column that uses the SUM (Order_ID) DAX formula.
- D . Create a calculated column that uses the COUNTA (Order_ID) DAX formula.
Note: This question is a part of a series of questions that present the same scenario. For your convenience, the scenario is repeated in each question. Each question presents a different goal and answer choices, but the text of the scenario is exactly the same in each question in this series.
Start of repeated scenario
You have a Microsoft SQL Server database that contains the following tables.
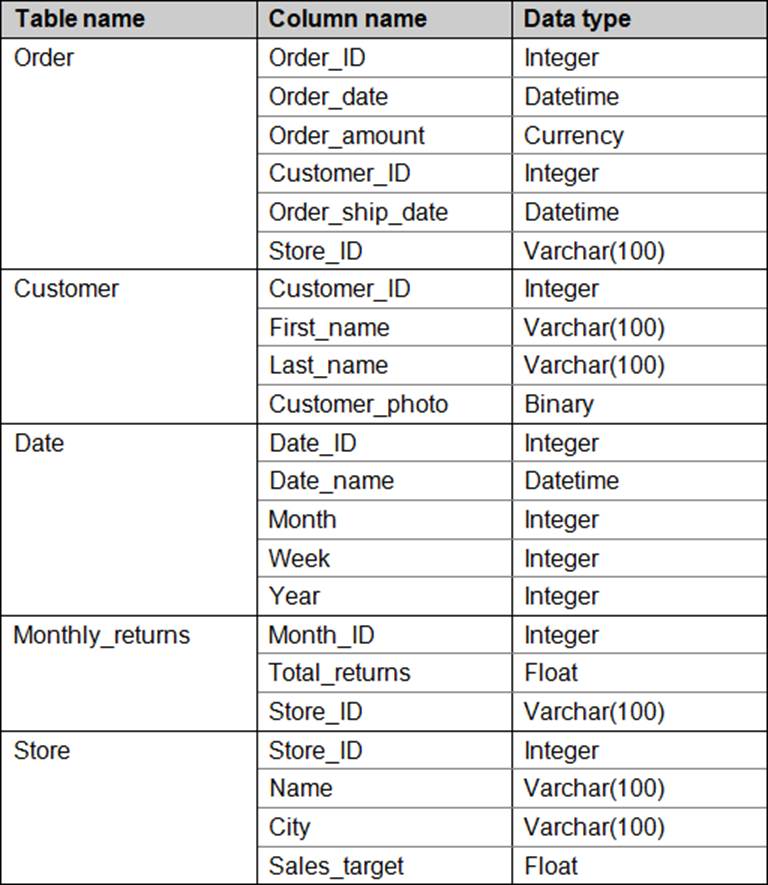
The following columns contain data information:
– Date[Month] in the mmyyyy format
– Date[Date_ID] in the ddmmyyyy format
– Date[Date_name] in the mm/dd/yyyy format
– Monthly_returns[Month_ID] in the mmyyyy format
The Order table contains more than one million rows.
The Store table has relationship to the Monthly_returns table on the Store_ID column. This is the only relationship between the tables.
You plan to use Power BI desktop to create an analytics solution for the data.
End of repeated scenario.
You plan to create a chart that displays total Order [Order_amount] by Store [Name].
You need to modify the model to ensure that you can create the chart.
Which two actions should you perform? Each correct answer presents part of the solution.
NOTE: Each correct selection is worth one point.
- A . To the Order table, add a column that uses the RELATED(‘Store’ [Store_ID]) DAX formula.
- B . Create a relationship between the Order table and the Store table.
- C . To the Order table, add a measure that uses the COUNT (‘Order’[Order_amount]) DAX formula.
- D . To the order table, add a measure that uses the SUM (‘Order’ [Order_amount]) DAX formula.
DRAG DROP
Note: This question is a part of a series of questions that present the same scenario. For your convenience, the scenario is repeated in each question. Each question presents a different goal and answer choices, but the text of the scenario is exactly the same in each question in this series.
Start of repeated scenario
You have a Microsoft SQL Server database that contains the following tables.
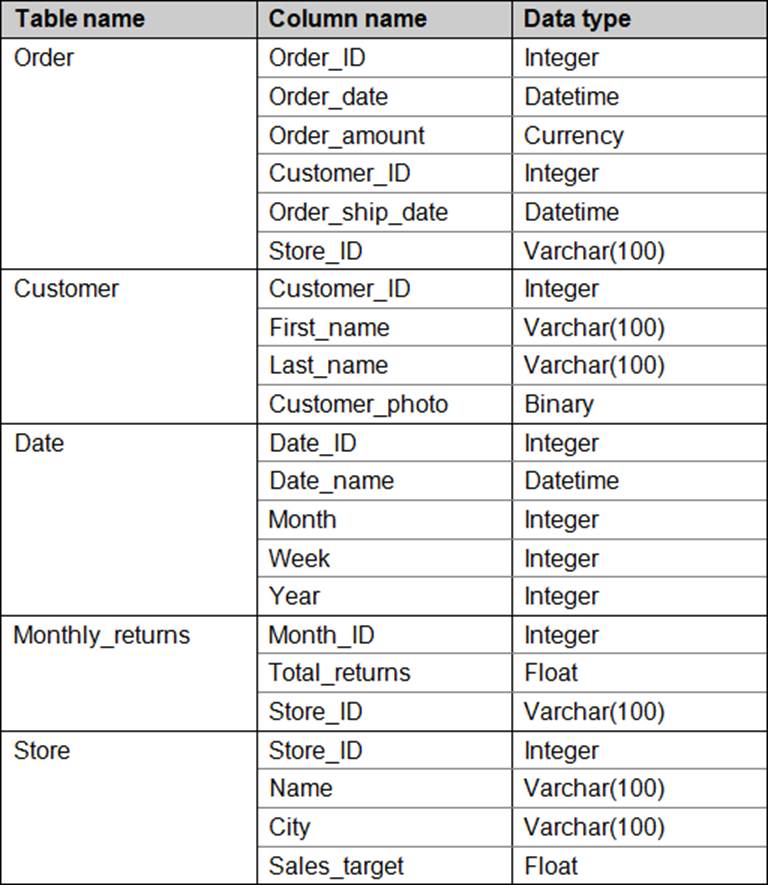
The following columns contain data information:
– Date[Month] in the mmyyyy format
– Date[Date_ID] in the ddmmyyyy format
– Date[Date_name] in the mm/dd/yyyy format
– Monthly_returns[Month_ID] in the mmyyyy format
The Order table contains more than one million rows.
The Store table has relationship to the Monthly_returns table on the Store_ID column. This is the only relationship between the tables.
You plan to use Power BI desktop to create an analytics solution for the data.
End of repeated scenario.
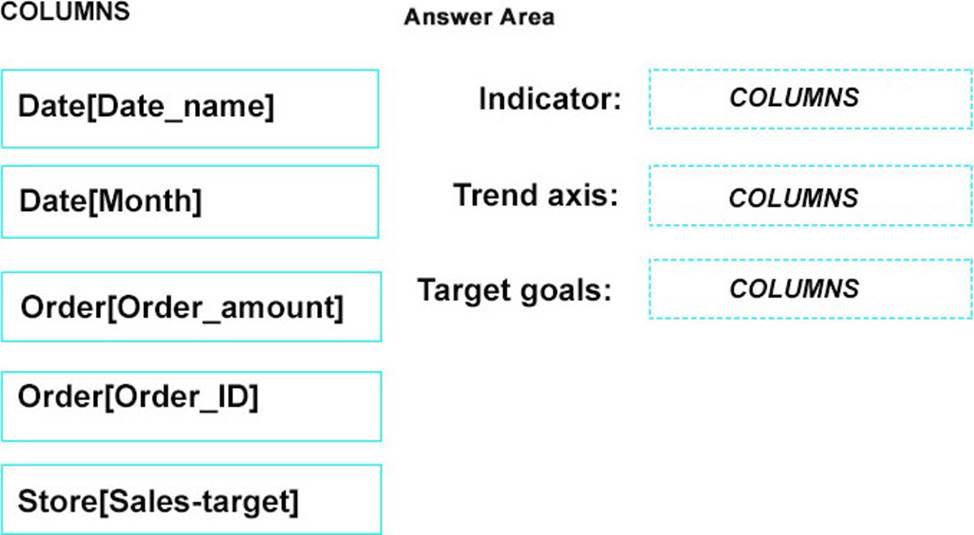
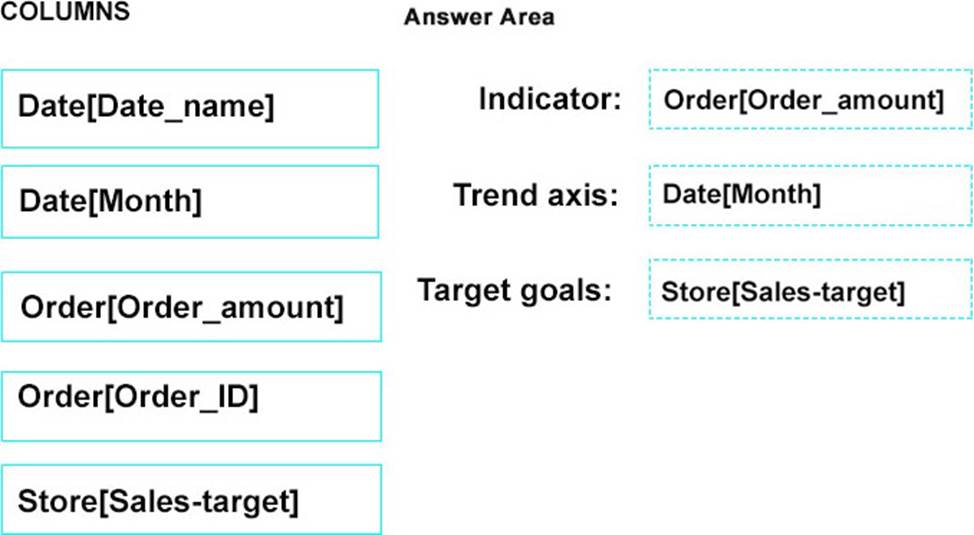
You need to configure a KPI indicator to show the monthly sales of a store versus the target sales of the store.
How should you configure the KPI indicator? To answer, drag the appropriate column to the correct fields. Each column may be used once, more than once, or not at all. You may need to drag the split bar between panes or scroll to view content.
NOTE: Each correct selection is worth one point.
You plan to use Power BI Desktop to create a report. The report will consume data from an on-premises tabular named SalesDB in Microsoft SQL Server Analysis Services (SSAS). The report will be published to the Power BI service.
You need to ensure that the report published to the Power BI service will access the current data in SalesDB.
What should you do?
- A . Deploy an on-premises data gateway and configure the connection to SalesDB to use the Import Data Connectivity mode.
- B . Deploy an on-premises data gateway and configure the connection to SalesDB to use the Connect live option.
- C . Deploy an on-premises data gateway (personal mode) and configure to SalesDB to use the DirectQuery Data Connectivity mode.
- D . Deploy an on-premises data gateway and configure the connection to SalesDB to use the DirectQuery Data Connectivity mode.
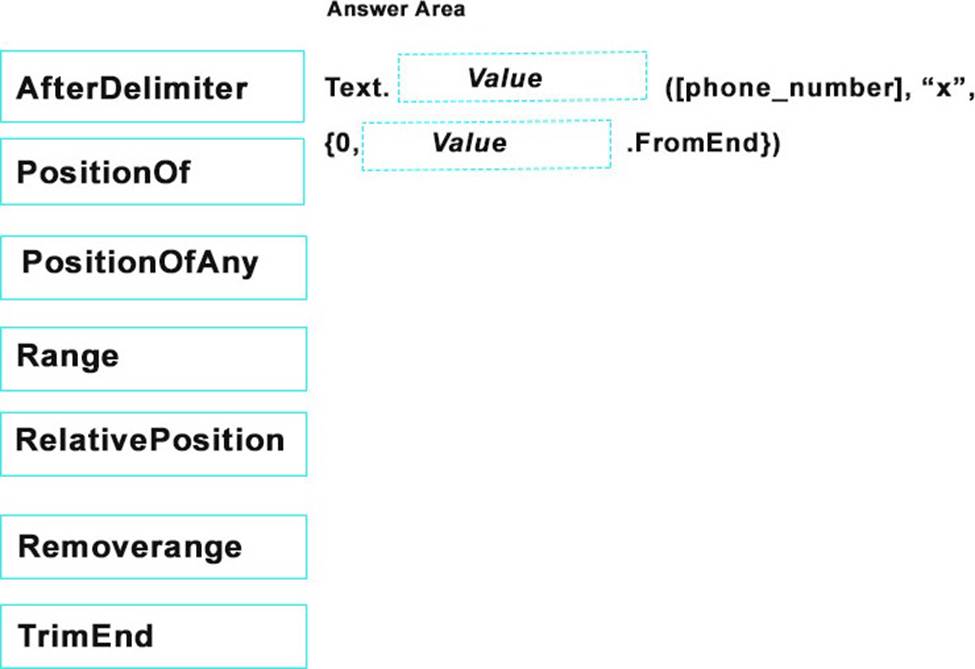
DRAG DROP
You have a column named phone_number. The values in the columns are in one of the following formats:
– 999-999-9999×123
– 1-999-999-9999×232
– +1-999-999-9999x66x666
The values after x in the phone-number column indicate the phone extension.
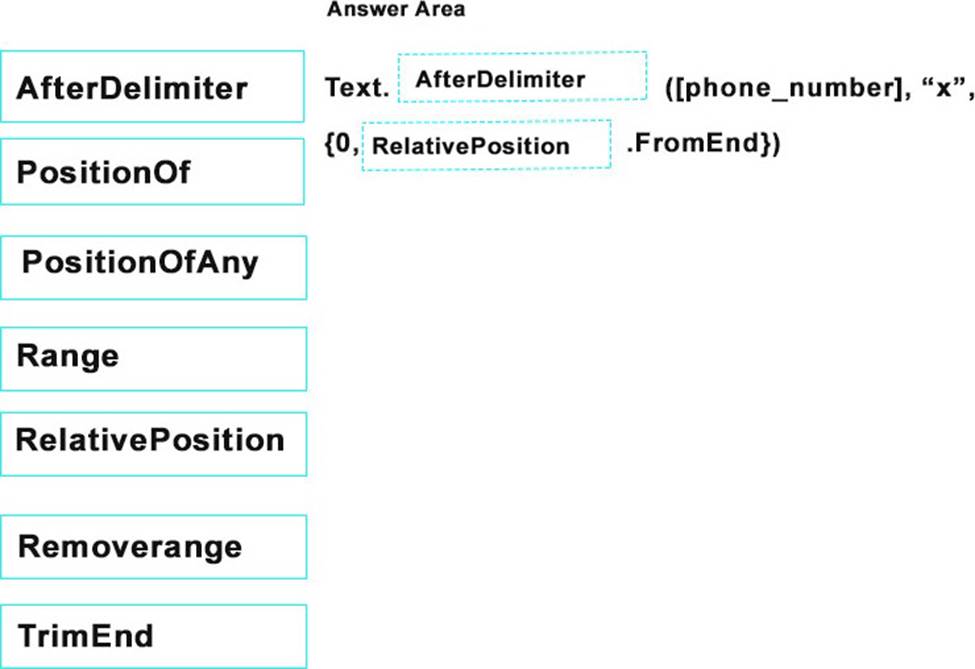
You need to create a custom column in Query Editor that contains only the phone extensions.
How should you complete the query? To answer, drag the appropriate values to the correct targets. Each value may be used once, more than once, or not at all. You may need to drag the split bar between panes or scroll to view content.
NOTE: Each correct selection is worth one point.
From Power BI Desktop, you create a query that imports the following table.
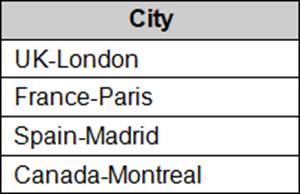
You need to configure the table to appear as shown in the following table.
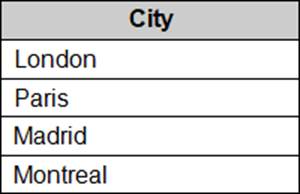
What should you do?
- A . From the Extract menu, click Last Characters.
- B . From the Extract menu, click Text After Delimiter.
- C . From the Format menu, click Trim.
- D . From the Split Column menu, click BY Delimiter.
HOTSPOT
You have the following tables.
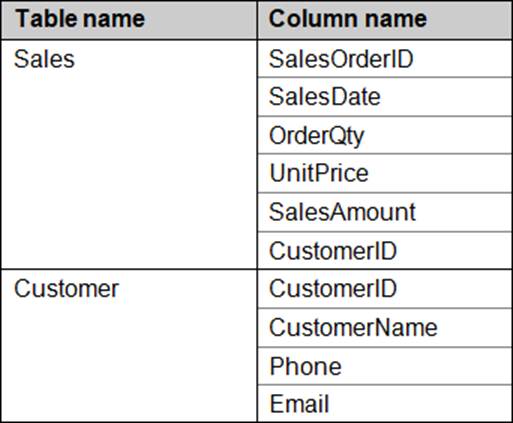
You need to create a new table that displays the top 10 customers by the total of SalesAmount.
How should you complete the DAX formula? To answer, select the appropriate options in the answer area.
NOTE: Each correct selection is worth one point.

You plan to create several datasets by using the Power BI service.
You have the files configured as shown in the following table.

You need to identify which files can be used as datasets.
Which two files should you identify? Each correct answer presents part of the solution.
NOTE: Each correct selection is worth one point.
- A . Data 1
- B . Data2
- C . Data 3
- D . Data4
- E . Data 5
You have the following two queries in Power BI Desktop:
– A query named Query1 that retrieves a table named SMB_Customers from a Microsoft SQL Server database
– A query named Query2 that retrieves a table named Enterprise_Customers from an Oracle database
Both tables have the same columns.
You need to combine the data from SMB_Customers and Enterprise_Customers.
Which command should you use?
- A . Combine Files
- B . Merge Columns
- C . Merge Queries
- D . Append Queries
You have a table in Power BI Desktop as shown in the following exhibit.
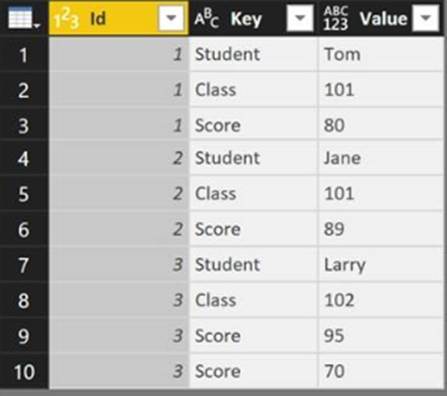
You pivot the columns as shown in the following exhibit.

You need to resolve the error in row 3. The solution must preserve all the data.
What should you do?
- A . Change the Data Type of the Value column.
- B . Select the Score column, and then click Remove Errors.
- C . Select the Key column, and then click Remove Duplicates
- D . Change the Aggregate Value Function of the pivot.
Latest 70-778 Dumps Valid Version with 147 Q&As
Latest And Valid Q&A | Instant Download | Once Fail, Full Refund



I believe there are several wrong answers in this