Microsoft 70-778 Analyzing and Visualizing Data with Microsoft Power BI Online Training
Microsoft 70-778 Online Training
The questions for 70-778 were last updated at Apr 19,2025.
- Exam Code: 70-778
- Exam Name: Analyzing and Visualizing Data with Microsoft Power BI
- Certification Provider: Microsoft
- Latest update: Apr 19,2025
DRAG DROP
Note: This question is a part of a series of questions that present the same scenario. For your convenience, the scenario is repeated in each question. Each question presents a different goal and answer choices, but the text of the scenario is exactly the same in each question in this series.
Start of repeated scenario
You have a Microsoft SQL Server database that has the tables shown in the Database Diagram exhibit. (Click the Exhibit.)
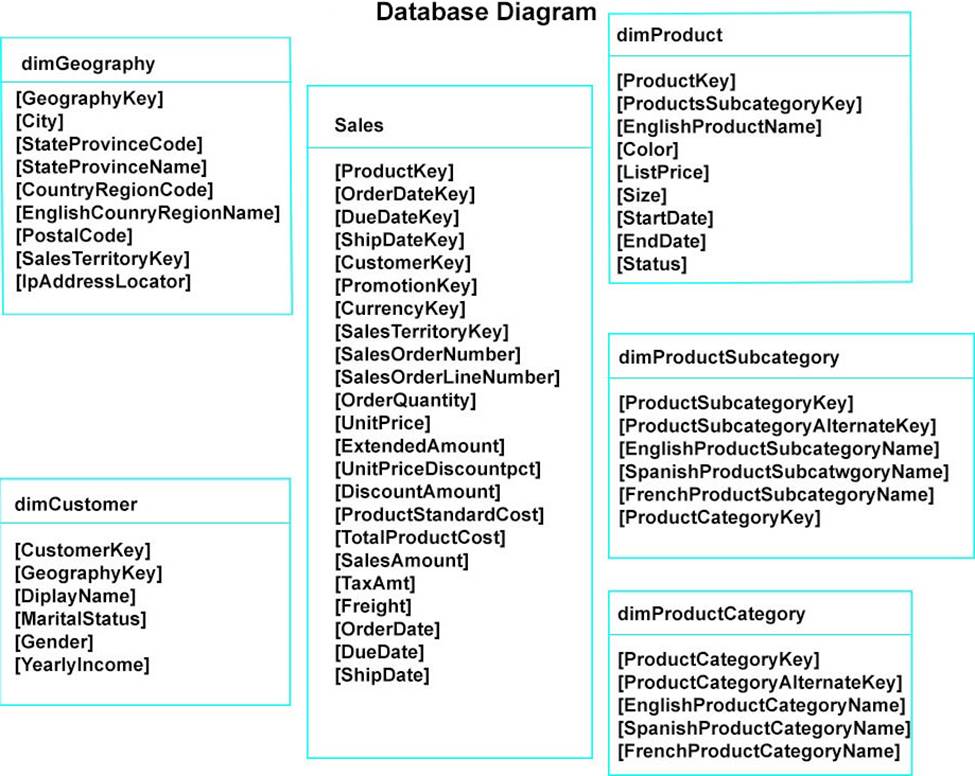
You plan to develop a Power BI model as shown in the Power BI Model exhibit. (Click the Exhibit).
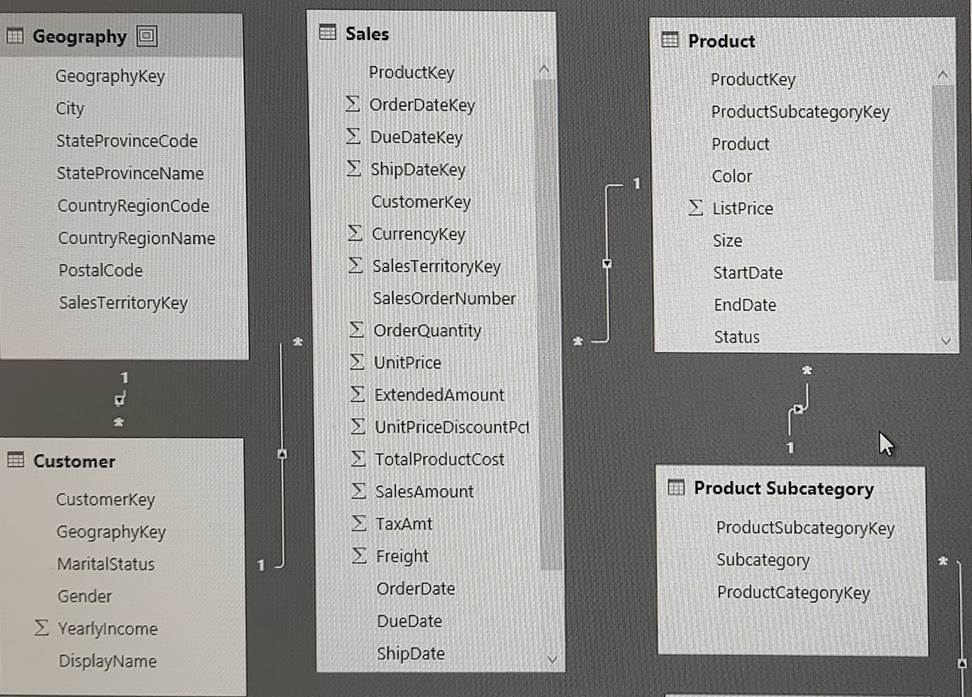
You plan to use Power BI to import data from 2013 to 2015.
Product Subcategory [Subcategory] contains NULL values.
End of repeated scenario.
You implement the Power BI model.
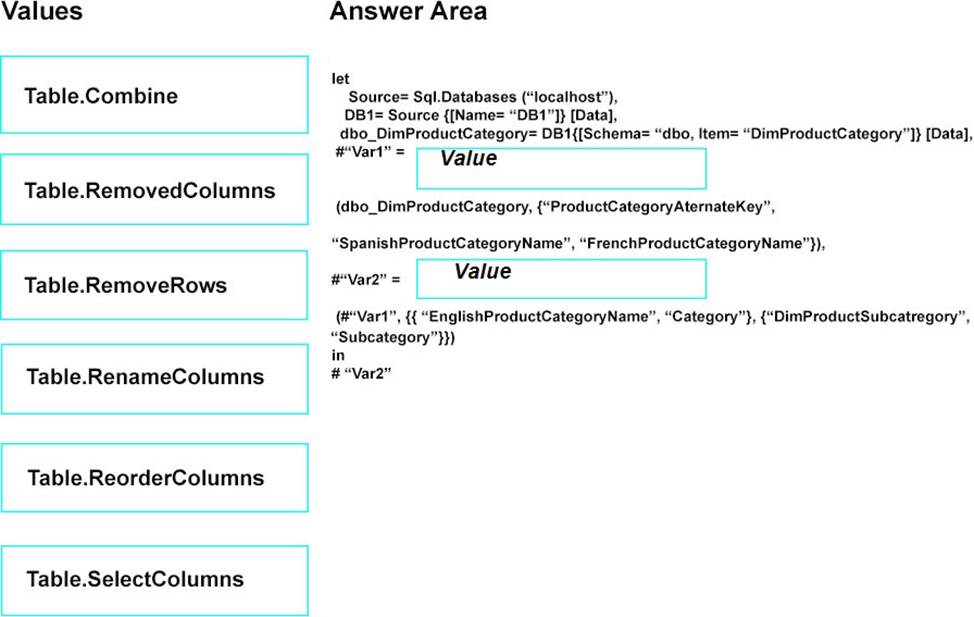
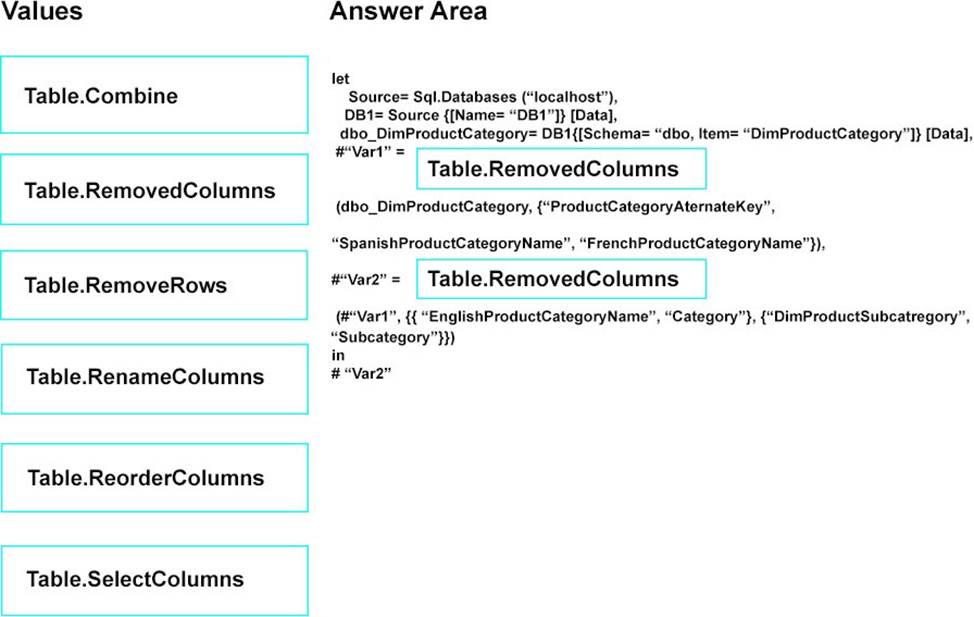
You need to edit the Product Category table query to match the desired Power BI model.
How should you complete the advanced query? To answer, drag the appropriate values to the correct targets. Each value may be used once, more than once, or not at all.
You may need to frag the split bar between panes or scroll to view content.
NOTE: Each correct selection is worth one point.
Note: This question is a part of a series of questions that present the same scenario. For your convenience, the scenario is repeated in each question. Each question presents a different goal and answer choices, but the text of the scenario is exactly the same in each question in this series.
Start of repeated scenario
You have a Microsoft SQL Server database that has the tables shown in the Database Diagram exhibit. (Click the Exhibit.)
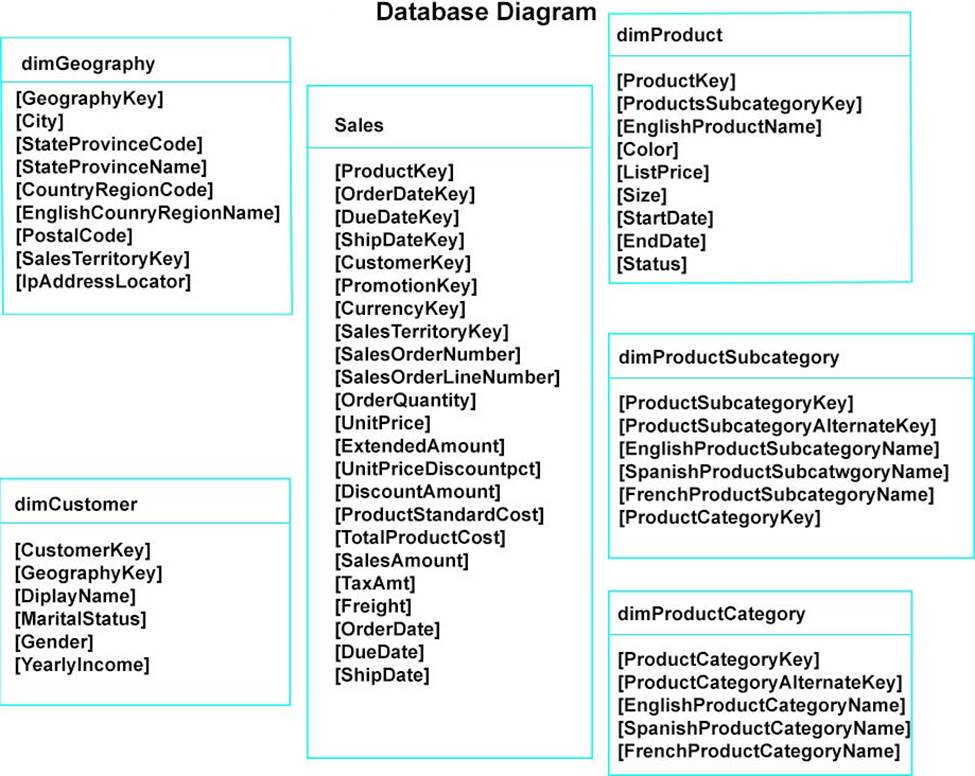
You plan to develop a Power BI model as shown in the Power BI Model exhibit. (Click the Exhibit).
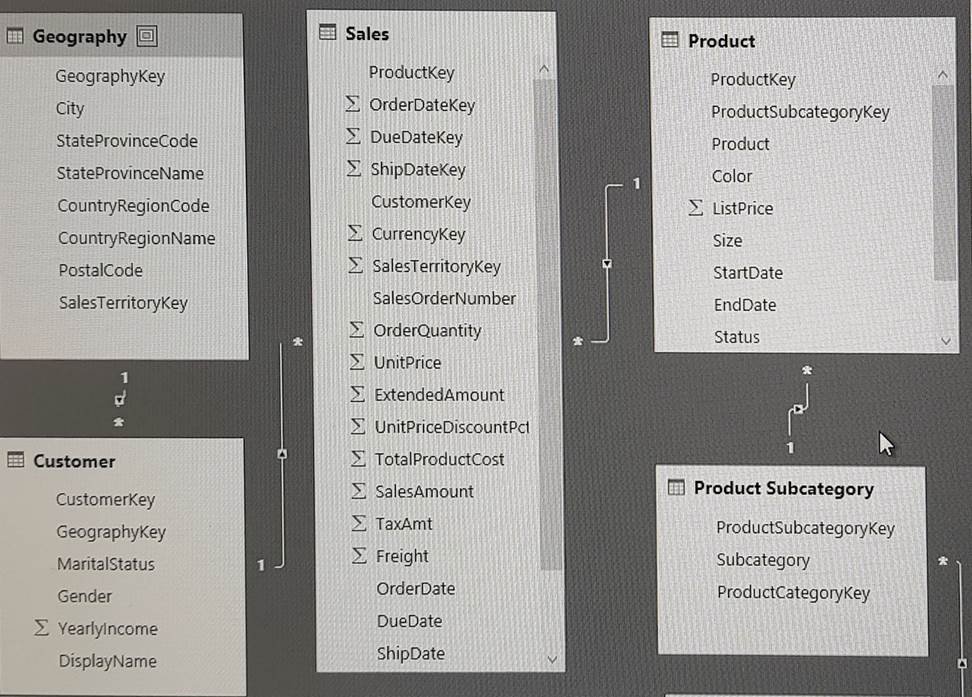
You plan to use Power BI to import data from 2013 to 2015.
Product Subcategory [Subcategory] contains NULL values.
End of repeated scenario.
You implement the Power BI model.
You add another table named Territory to the model.
A sample of the data is shown in the following table.
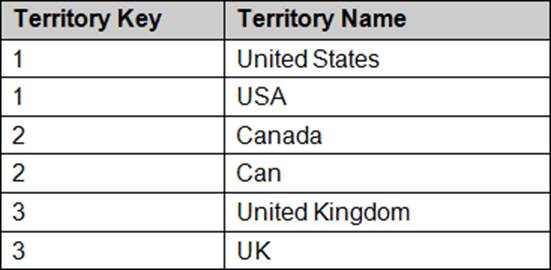
You need to create a relationship between the Territory table and the Sales table.
Which function should you use in the query for Territory before you create the relationship?
- A . Table.RemoveMatchingRows
- B . Table.Distinct
- C . Table.InDistinct
- D . Table.ReplaceMatchingRows
Note: This question is a part of a series of questions that present the same scenario. For your convenience, the scenario is repeated in each question. Each question presents a different goal and answer choices, but the text of the scenario is exactly the same in each question in this series.
Start of repeated scenario
You have a Microsoft SQL Server database that has the tables shown in the Database Diagram exhibit. (Click the Exhibit.)
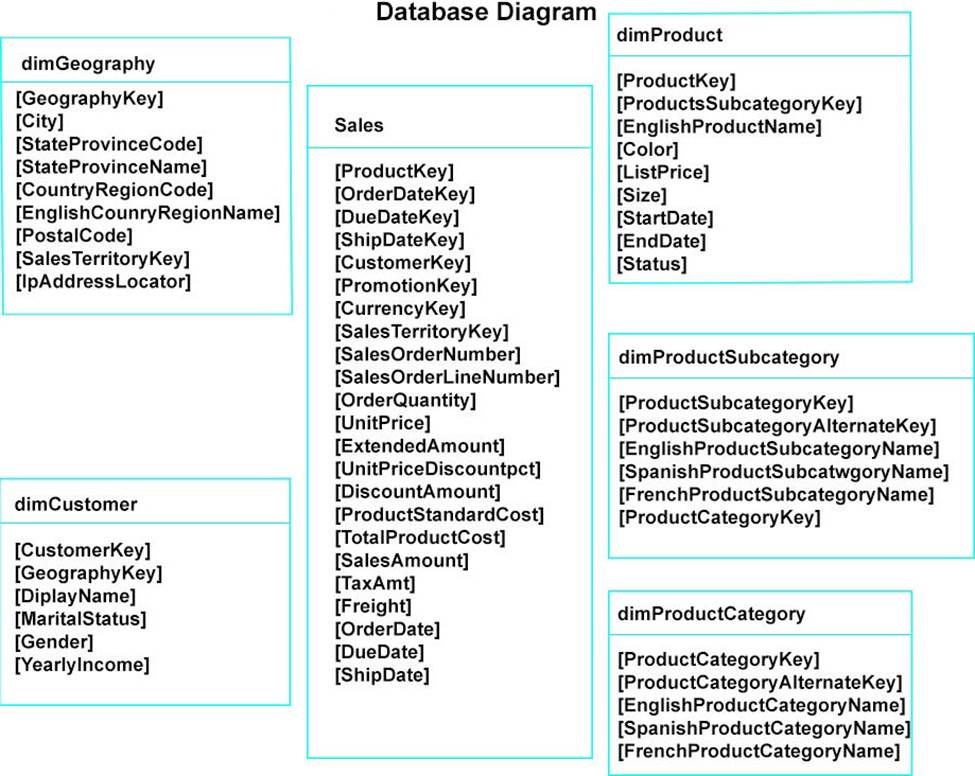
You plan to develop a Power BI model as shown in the Power BI Model exhibit. (Click the Exhibit).
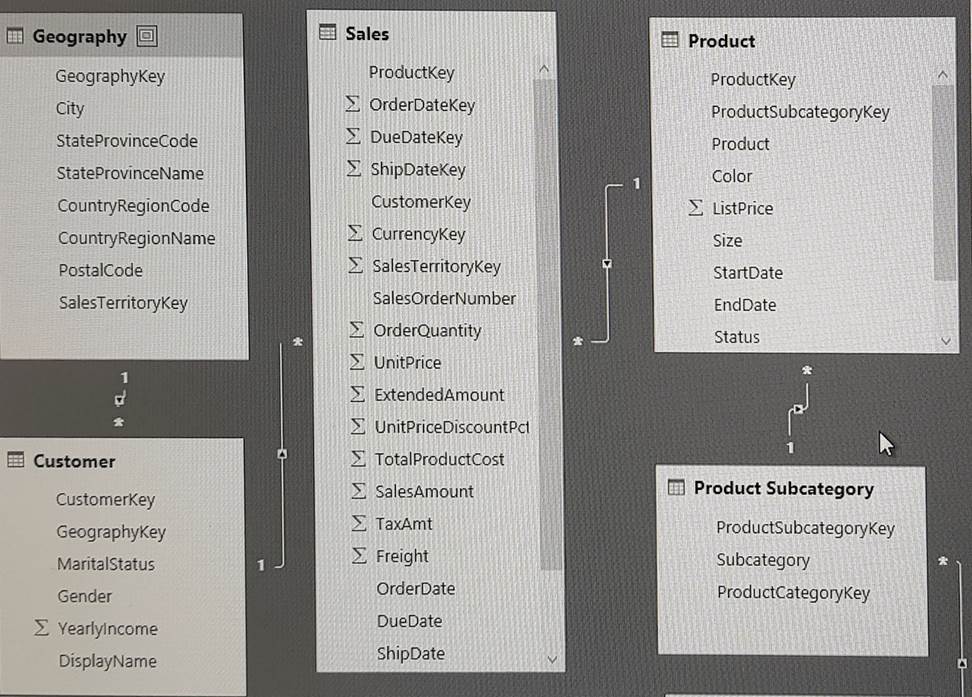
You plan to use Power BI to import data from 2013 to 2015.
Product Subcategory [Subcategory] contains NULL values.
End of repeated scenario.
You implement the Power BI model.
You need to add a measure to rank total sales by product.
The results must appear as shown in the following table.
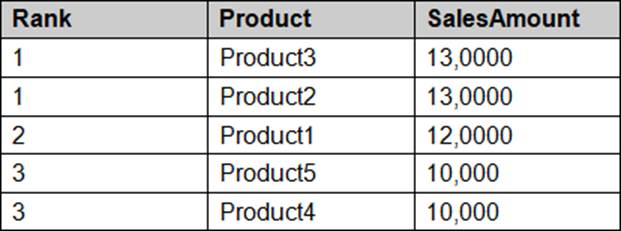
Which DAX formula should you use?
- A . Product Ranking= RANKX (Product, [SalesAmount], , DESC, Skip)
- B . Product Ranking= RANKX (ALL, (‘Product’), [SalesAmount], , DESC, Dense)
- C . Product Ranking= RANKX (ALL, (‘Product’), [SalesAmount], , DESC, Skip)
- D . Product Ranking= RANKX (ALL (‘Product’), [SalesAmount], , Asc, Dense
You manage a Power BI model has a table named Sales and product.
You need to ensure that a sales team can view only data that has a CountryRegionName value of United States and a ProductCategory value of Clothing.
What should you do from Power BI Desktop?
- A . From Power BI Desktop, create a new role that has the following filter.[countryRegionName]= “United States” && [ProductCategory]= “Clothing”
- B . Add the following filters in Query Editor.CountryRegionName is United StatesProductCategory is Clothing
- C . From Power BI Desktop, create a new role that has the following filters.[CountryRegionName]= “United States”
- D . Add the following filters to a report.CountryRegionName is United SatesProductCategory is Clothing
In the Power BI service, you create an app workplace that contains several dashboards.
You need to provide a user named [email protected] with the ability to edit and publish dashboards.
What should you do?
- A . Modify the members of the app workspace.
- B . Configure security for the dataset used by the app.
- C . Share the dashboard, and then modify the Access settings of the dashboard.
- D . From the app workspace, click Update app, and then configure the Access settings.
Your organization has a team of power users who recently created 20 Power BI dashboards.
The power users share the dashboards with other users in the organization.
When the users attempt to access the dashboards, they receive the error message shown in the exhibit. (Click the Exhibit.)
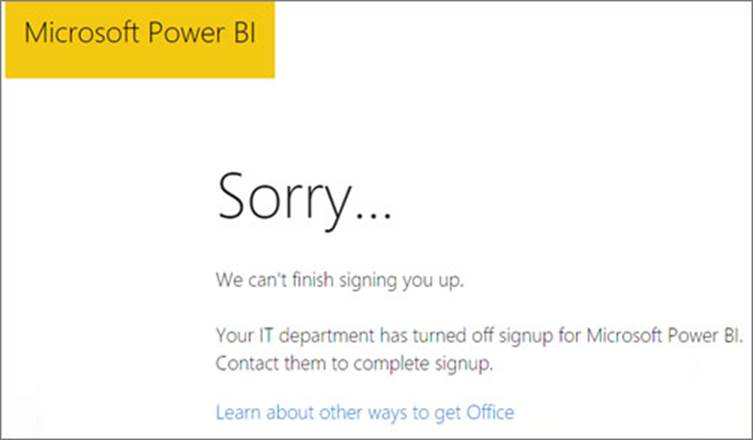
You need to ensure that all the users can access the dashboards.
What should you do first?
- A . From the Microsoft Office 365 Admin center, and the Power BI (free) subscription, and then assign a license to each user.
- B . From the Power BI Admin portal, modify the Privacy Settings.
- C . From the properties of each dashboard, modify the Share dashboard settings.
- D . Instruct each user to install Microsoft Office 2016.
DRAG DROP
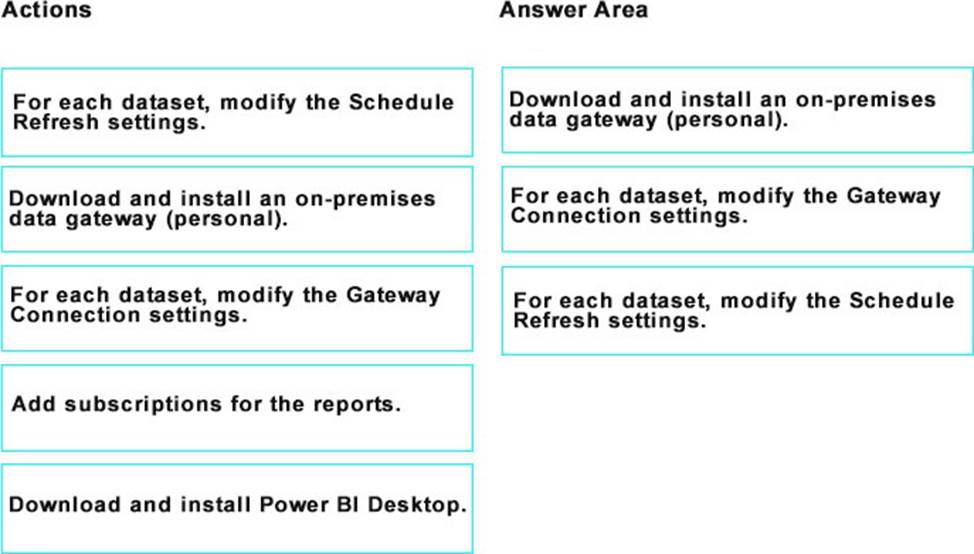
You have a Microsoft Excel workbook that contains two tables.
From Power BI, you create a dashboard that displays data from the tables.
You update the tables each day.
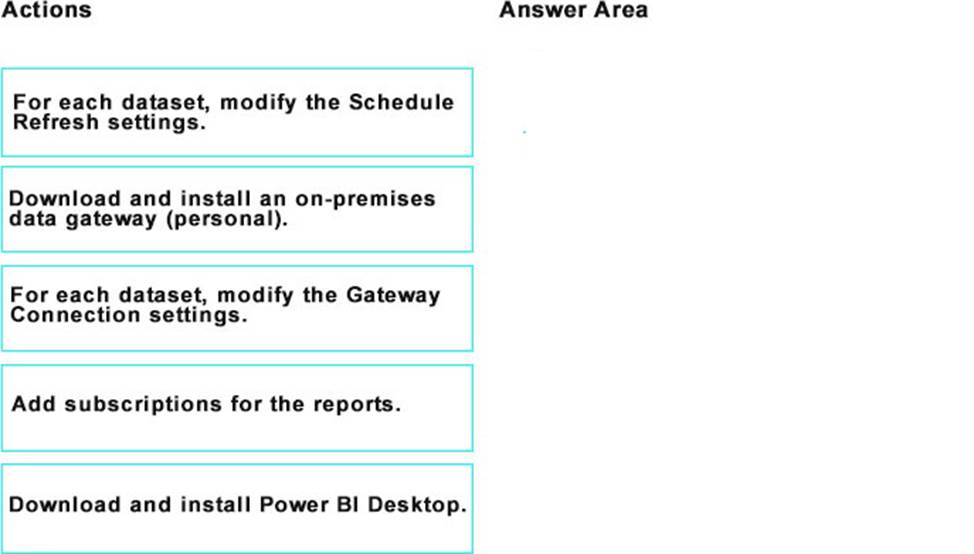
You need to ensure that the virtualizations in the dashboard are updated daily.
Which three actions should you perform in sequence? To answer, move the appropriate actions from the list of actions to answer area and arrange them in the correct order.
You embed a Power BI report in a Microsoft SharePoint Online page.
A user name User1 can access the SharePoint Online page, but the Power BI web part displays the following error message: “This content isn’t available”.
User1 is unable to view the report.
You verify that you can access the SharePoint Online page and that the Power BI report displays as expected.
You need to ensure that User1 can view the report form SharePoint Online.
What should you do?
- A . Publish the app workspace.
- B . Edit the settings of the Power BI web part.
- C . Modify the members of the app workplace.
- D . Share the dashboards in the app workspace.
HOTSPOT
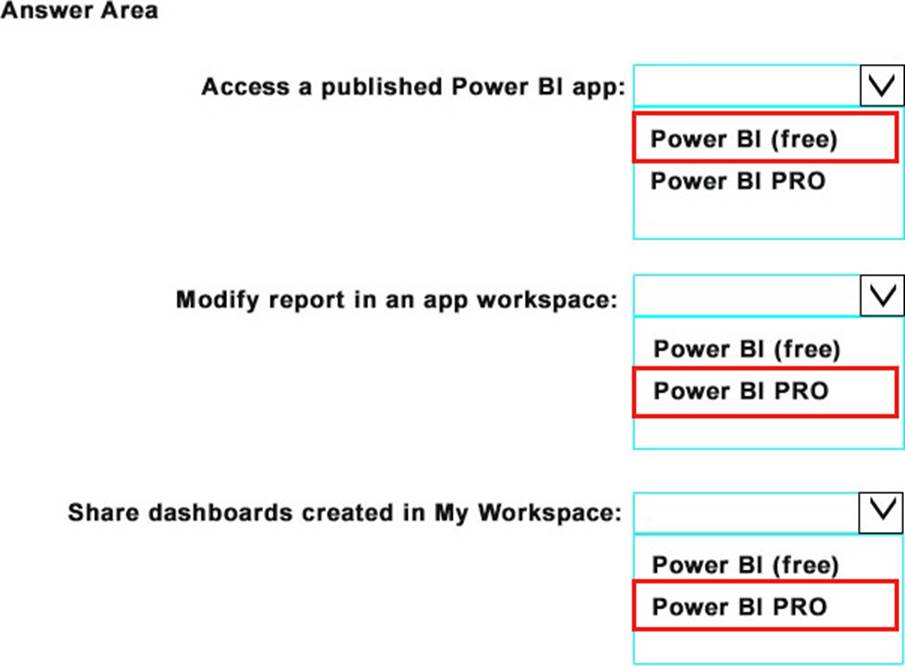
Your company plans to use Power BI for 20 users in the sales department.
The users will perform the following tasks:
– Access a published Power BI app
– Modify reports in an app workspace
– Share dashboards created in My Workspace
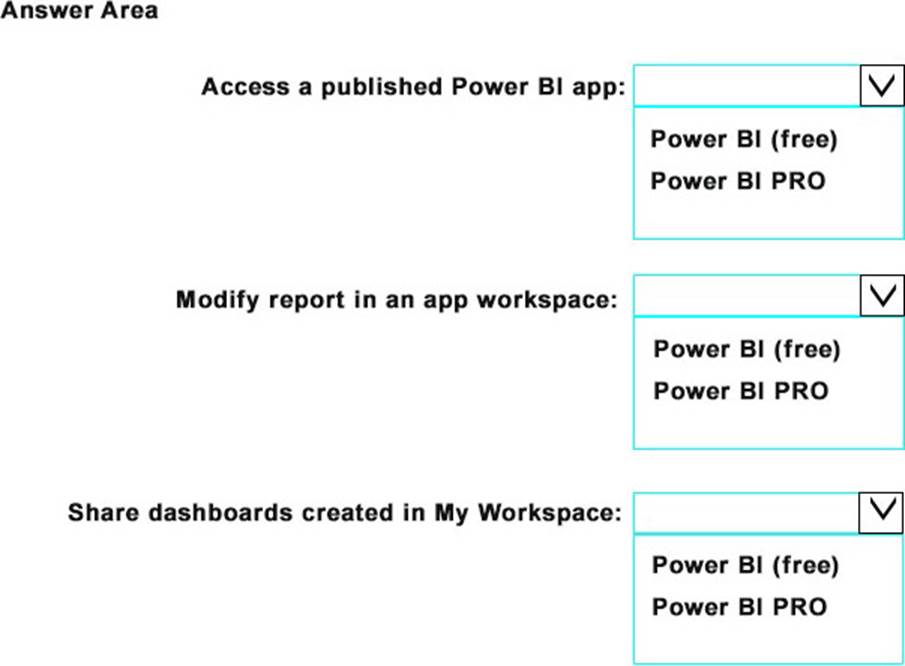
You need to identify which Power BI licenses are required for the tasks. The solution must use the Power BI (free) licenses, whenever possible.
Which license should you identify for each task? To answer, select the appropriate options in the answer area.
NOTE: Each correct selection is worth one point.
You have an app workspace that contains a dashboard and four reports. All the reports are generated from a single dataset that contains sales data for your company.
The reports display the data configured as shown in the following table.
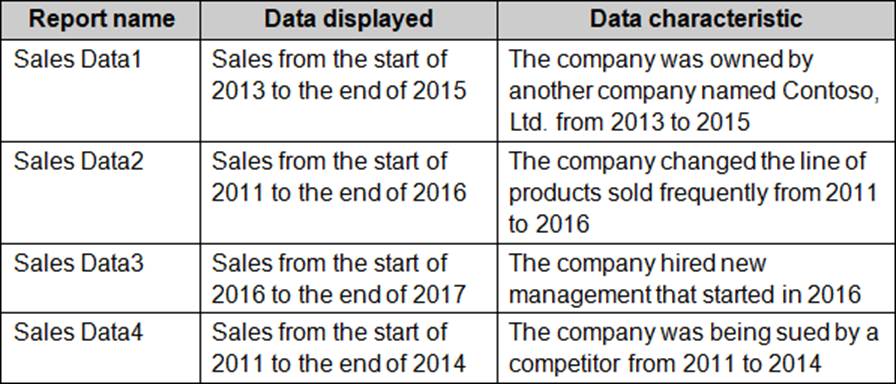
You need to ensure that the users of the reports can locate the correct report by using natural language queries.
What should you do?
- A . From the properties of the dataset, create four Featured Q&A Questions.
- B . From the Format settings of the reports, modify the Page Information.
- C . From the properties of the dataset, modify the Q&A and Cortana settings.
- D . From the properties of the workspace, modify the Language Settings.
Latest 70-778 Dumps Valid Version with 147 Q&As
Latest And Valid Q&A | Instant Download | Once Fail, Full Refund


I believe there are several wrong answers in this