IIBA CBDA Certification in Business Data Analytics (IIBA – CBDA) Online Training
IIBA CBDA Online Training
The questions for CBDA were last updated at Apr 25,2025.
- Exam Code: CBDA
- Exam Name: Certification in Business Data Analytics (IIBA - CBDA)
- Certification Provider: IIBA
- Latest update: Apr 25,2025
Senior executives in a large organization receive numerous sales reports of every sale through a corporate dashboard on a weekly basis. The executives are considering budget increases for various functions but would like to know if they are obtaining good returns for current budget allocations. They ask the analytics team to research and answer: "How effective is our marketing spend?" This question is:
- A . Already answered in the sales data
- B . Difficult to analyze because its narrowly focused
- C . Sufficient to begin initial analysis
- D . Too broadly scoped to be effectively answered
The analytics team is struggling with which recommendation to make. Their challenge is that they have five good options and this indecision is stopping them from moving forward.
To help the team finalize their recommendation, the BA professional on the team recommends they complete:
- A . Root cause analysis
- B . Business rules analysis
- C . Data flow diagrams
- D . Acceptance and evaluation criteria
The analytics team is assessing the results of their analysis. They are surprised to find that their data indicates two events seem to be strongly related even though the general belief in the organization is that they are independent of each other. Knowing that this information will be used for decision making, they are concerned about presenting this data.
At an impasse, the business analysis professional reminds them that the data can be presented as long as the team has:
- A . Review the results with management ahead of time and highlight any potential risk of using this data
- B . Confidence that the correlation will reliably occur in the future and the risk of acting on this is low
- C . Followed all rules for data analysis endorsed as organizational standards so the risk of acting on this is low
- D . The ability to rerun the data analysis and the results are the same thereby minimizing the risk of acting on this
An analytics team has been asked to answer the following question: "Given that you’re a customer, would you work at our company?"
The team is concerned about answering this question because it is:
- A . Insignificant
- B . Short
- C . Unethical
- D . Unclear
A data scientist is performing statistical analysis and is interested in graphically depicting the data set according to the associated quartiles Minimum, First Quartile, Median, Second Quartile, Third Quartile.
Which technique would allow for the display of this statistical five number summary?
- A . Gaussian distribution
- B . Scatter plot
- C . Multivariate histogram
- D . Box plot
An online retailer has been successful utilizing analytics to guide decisions on product placement and marketing spend.
Management has requested a task force be assembled to make recommendations on how to further develop their analytics capabilities. To begin this work, the task force builds a model to develop a shared understanding about customer segments, customer relationships, key partnerships, and the company’s value proposition.
The team has leveraged the following model to facilitate this discussion?
- A . Value chain analysis
- B . Balanced scorecard
- C . Business model canvas
- D . CATWOE
While sourcing data, an analyst runs into a situation where different business units are using different names to refer to the same data element. This lack of standardization is resulting in confusion and additional time required to properly prepare data for analysis.
Which practice, if implemented would address this situation and mature the organization’s business analytics practice?
- A . Data quality management
- B . Database operations management
- C . Data warehousing
- D . Meta data management
A dataset contains 10 measures of workplace sustainability. The analytics team is in need of producing a single score of sustainability.
Which of the following techniques if used would achieve this objective?
- A . Logistic regression
- B . Linkage algorithms
- C . Factor analysis
- D . K means clustering
An analyst is looking at a particular dataset that includes the scores across all 8th grade students, across three schools. The analyst is trying to determine which type of statistics average to use to best represent the results. On looking through the dataset, the analyst has identified a few extreme outliers. As a result, the analyst was led to use the following type of average:
- A . Median
- B . Range
- C . Mean
- D . Mode
A software company launched a new product in late 2016. The product manager is reviewing a Box and Whisker plot used to compare year-over-year sales, from 2017 to 2018.
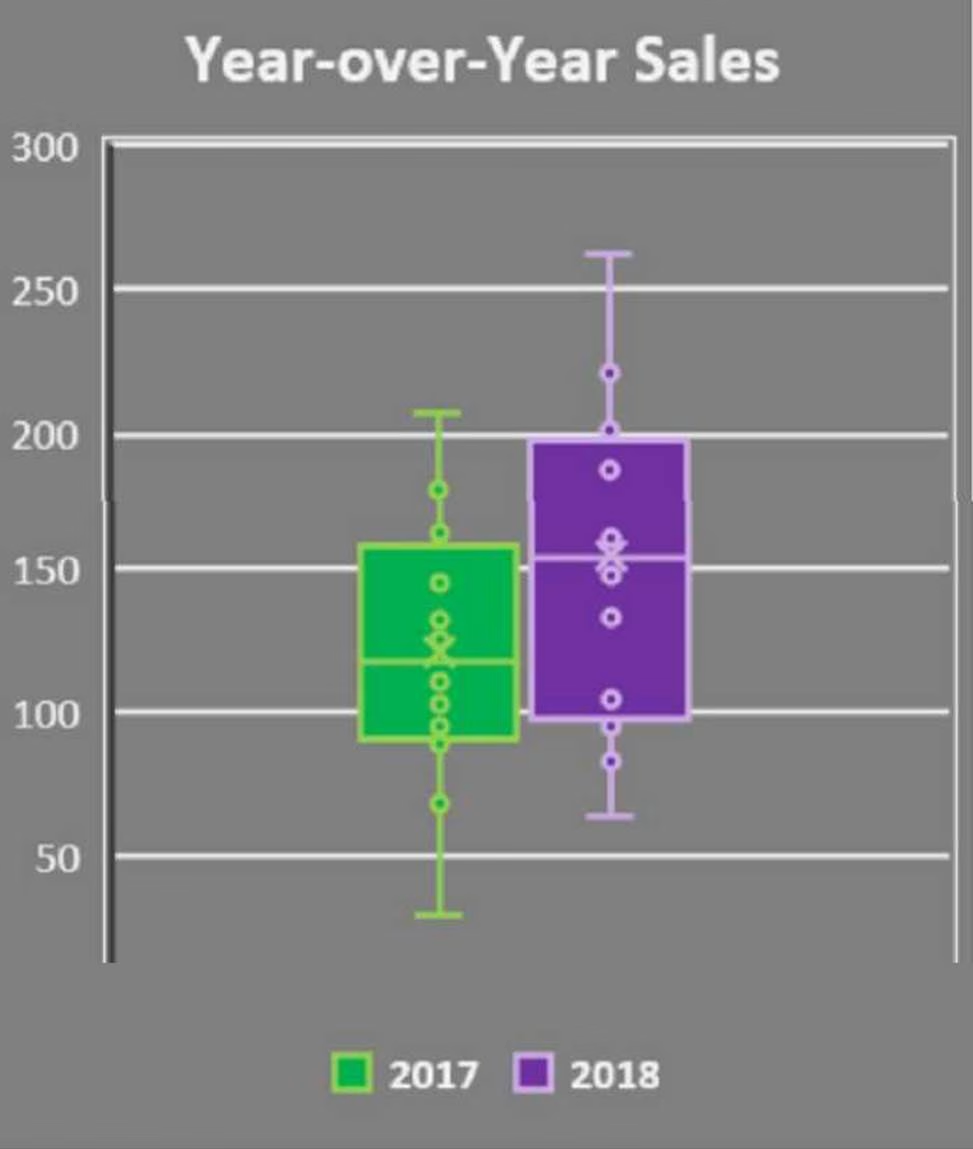
What is the conclusion he can make from this chart?
- A . 2017 minimum and maximum sales are higher than 2018, and the 2017 median result is higher than the 2018 median result
- B . 2017 minimum and maximum sales are higher than 2018, but the 2017 median result is lower than 2018 1st quartile result
- C . 2018 minimum and maximum sales are higher than 2017, and the 2018 quartile results are higher than 2017 quartile results
- D . 2018 minimum and maximum sales are higher than 2017, and the 2018 1st quartile is higher than 2017 median result
Latest CBDA Dumps Valid Version with 152 Q&As
Latest And Valid Q&A | Instant Download | Once Fail, Full Refund
