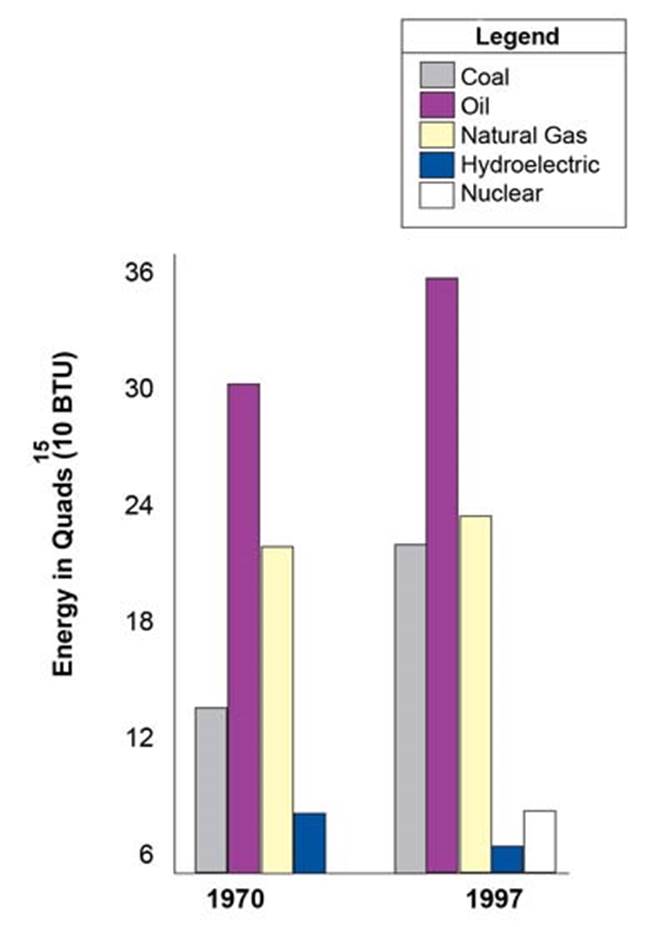
If 1970―1997 trends continue, which statement could be predicted from the bar graph?
If 1970―1997 trends continue, which statement could be predicted from the bar graph?

A . Use of oil for energy production will decrease.
B . Use of hydroelectric energy will increase.
C . Use of coal for energy production will increase.
D . Use of nuclear power will remain the same.
E . Total energy use will decrease in the future.
Answer: C
Latest GED Science Dumps Valid Version with 300 Q&As
Latest And Valid Q&A | Instant Download | Once Fail, Full Refund
Subscribe
Login
0 Comments
Inline Feedbacks
View all comments

