

As the lead ML Engineer for your company, you are responsible for building ML models to digitize scanned customer forms. You have developed a TensorFlow model that converts the scanned images into text and stores them in Cloud Storage. You need to use your ML model on the aggregated data collected at the end of each day with minimal manual intervention.
What should you do?
- A . Use the batch prediction functionality of Al Platform
- B . Create a serving pipeline in Compute Engine for prediction
- C . Use Cloud Functions for prediction each time a new data point is ingested
- D . Deploy the model on Al Platform and create a version of it for online inference.
A
Explanation:
Batch prediction is the process of using an ML model to make predictions on a large set of data points. Batch prediction is suitable for scenarios where the predictions are not time-sensitive and can be done in batches, such as digitizing scanned customer forms at the end of each day. Batch prediction can also handle large volumes of data and scale up or down the resources as needed. AI Platform provides a batch prediction service that allows users to submit a job with their TensorFlow model and input data stored in Cloud Storage, and receive the output predictions in Cloud Storage as well. This service requires minimal manual intervention and can be automated with Cloud Scheduler or Cloud Functions. Therefore, using the batch prediction functionality of AI Platform is the best option for this use case.
Reference: Batch prediction overview
Using batch prediction
You work for a global footwear retailer and need to predict when an item will be out of stock based on historical inventory data. Customer behavior is highly dynamic since footwear demand is influenced by many different factors. You want to serve models that are trained on all available data, but track your performance on specific subsets of data before pushing to production.
What is the most streamlined and reliable way to perform this validation?
- A . Use the TFX ModelValidator tools to specify performance metrics for production readiness
- B . Use k-fold cross-validation as a validation strategy to ensure that your model is ready for production.
- C . Use the last relevant week of data as a validation set to ensure that your model is performing accurately on current data
- D . Use the entire dataset and treat the area under the receiver operating characteristics curve (AUC ROC) as the main metric.
A
Explanation:
TFX ModelValidator is a tool that allows you to compare new models against a baseline model and evaluate their performance on different metrics and data slices1. You can use this tool to validate your models before deploying them to production and ensure that they meet your expectations and requirements.
k-fold cross-validation is a technique that splits the data into k subsets and trains the model on k-1 subsets while testing it on the remaining subset. This is repeated k times and the average performance is reported2. This technique is useful for estimating the generalization error of a model, but it does not account for the dynamic nature of customer behavior or the potential changes in data distribution over time.
Using the last relevant week of data as a validation set is a simple way to check the model’s performance on recent data, but it may not be representative of the entire data or capture the long-term trends and patterns. It also does not allow you to compare the model with a baseline or evaluate it on different data slices.
Using the entire dataset and treating the AUC ROC as the main metric is not a good practice because it does not leave any data for validation or testing. It also assumes that the AUC ROC is the only metric that matters, which may not be true for your business problem. You may want to consider other metrics such as precision, recall, or revenue.
You work on a growing team of more than 50 data scientists who all use Al Platform. You are designing a strategy to organize your jobs, models, and versions in a clean and scalable way.
Which strategy should you choose?
- A . Set up restrictive I AM permissions on the Al Platform notebooks so that only a single user or group can access a given instance.
- B . Separate each data scientist’s work into a different project to ensure that the jobs, models, and versions created by each data scientist are accessible only to that user.
- C . Use labels to organize resources into descriptive categories. Apply a label to each created resource so that users can filter the results by label when viewing or monitoring the resources
- D . Set up a BigQuery sink for Cloud Logging logs that is appropriately filtered to capture information about Al Platform resource usage In BigQuery create a SQL view that maps users to the resources they are using.
C
Explanation:
Labels are key-value pairs that can be attached to any AI Platform resource, such as jobs, models, versions, or endpoints1. Labels can help you organize your resources into descriptive categories, such as project, team, environment, or purpose. You can use labels to filter the results when you list or monitor your resources, or to group them for billing or quota purposes2. Using labels is a simple and scalable way to manage your AI Platform resources without creating unnecessary complexity or overhead. Therefore, using labels to organize resources is the best strategy for this use case.
Reference: Using labels
Filtering and grouping by labels
During batch training of a neural network, you notice that there is an oscillation in the loss.
How should you adjust your model
Oscillation in the loss during batch to ensure that it converges?
- A . Increase the size of the training batch
- B . Decrease the size of the training batch
- C . Increase the learning rate hyperparameter
- D . Decrease the learning rate hyperparameter
D
Explanation:
training of a neural network means
that the model is overshooting the optimal point of the loss function and
bouncing back and forth. This can prevent the model from converging to the
minimum loss value. One of the main reasons for this phenomenon is that the
learning rate hyperparameter, which controls the size of the steps that the
model takes along the gradient, is too high. Therefore, decreasing the learning
rate hyperparameter can help the model take smaller and more precise steps and
avoid oscillation. This is a common technique to improve the stability and
performance of neural network training12.
Reference: Interpreting Loss Curves
Is learning rate the only reason for training loss oscillation after few epochs?
You are building a linear model with over 100 input features, all with values between -1 and 1. You suspect that many features are non-informative. You want to remove the non-informative features from your model while keeping the informative ones in their original form.
Which technique should you use?
- A . Use Principal Component Analysis to eliminate the least informative features.
- B . Use L1 regularization to reduce the coefficients of uninformative features to 0.
- C . After building your model, use Shapley values to determine which features are the most informative.
- D . Use an iterative dropout technique to identify which features do not degrade the model when removed.
B
Explanation:
L1 regularization, also known as Lasso regularization, adds the sum of the absolute values of the model’s coefficients to the loss function1. It encourages sparsity in the model by shrinking some coefficients to precisely zero2. This way, L1 regularization can perform feature selection and remove the non-informative features from the model while keeping the informative ones in their original form. Therefore, using L1 regularization is the best technique for this use case.
Reference: Regularization in Machine Learning – GeeksforGeeks
Regularization in Machine Learning (with Code Examples) – Dataquest L1 And L2 Regularization Explained & Practical How To Examples L1 and L2 as Regularization for a Linear Model
Your team has been tasked with creating an ML solution in Google Cloud to classify support requests for one of your platforms. You analyzed the requirements and decided to use TensorFlow to build the classifier so that you have full control of the model’s code, serving, and deployment. You will use Kubeflow pipelines for the ML platform. To save time, you want to build on existing resources and use managed services instead of building a completely new model.
How should you build the classifier?
- A . Use the Natural Language API to classify support requests
- B . Use AutoML Natural Language to build the support requests classifier
- C . Use an established text classification model on Al Platform to perform transfer learning
- D . Use an established text classification model on Al Platform as-is to classify support requests
C
Explanation:
Transfer learning is a technique that leverages the knowledge and weights of a pre-trained model and adapts them to a new task or domain1. Transfer learning can save time and resources by avoiding training a model from scratch, and can also improve the performance and generalization of the model by using a larger and more diverse dataset2. AI Platform provides several established text classification models that can be used for transfer learning, such as BERT, ALBERT, or XLNet3. These models are based on state-of-the-art natural language processing techniques and can handle various text classification tasks, such as sentiment analysis, topic classification, or spam detection4. By using one of these models on AI Platform, you can customize the model’s code, serving, and deployment, and use Kubeflow pipelines for the ML platform. Therefore, using an established text classification model on AI Platform to perform transfer learning is the best option for this use case.
Reference: Transfer Learning – Machine Learning’s Next Frontier
A Comprehensive Hands-on Guide to Transfer Learning with Real-World Applications in Deep Learning
Text classification models
Text Classification with Pre-trained Models in TensorFlow
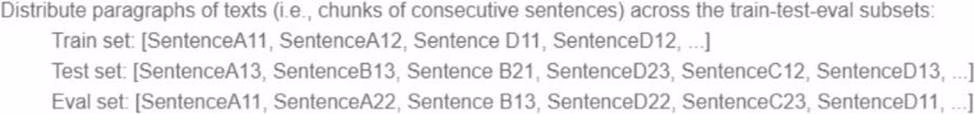
Your team is working on an NLP research project to predict political affiliation of authors based on articles they have written.
You have a large training dataset that is structured like this:
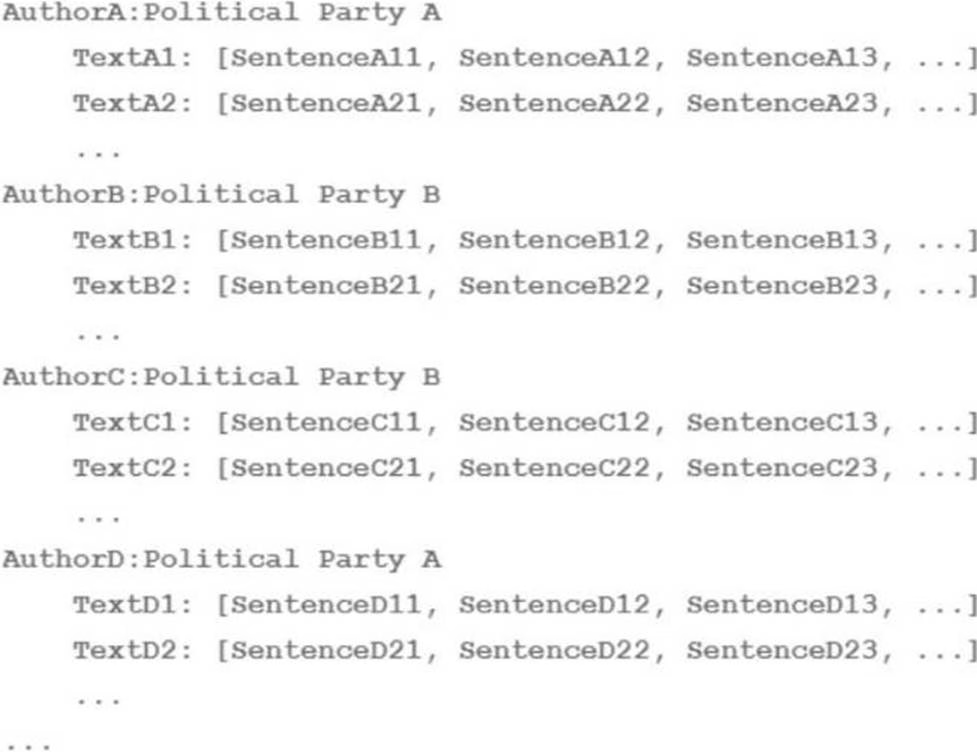

You followed the standard 80%-10%-10% data distribution across the training, testing, and evaluation subsets.
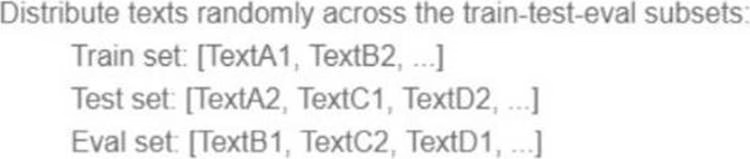
How should you distribute the training examples across the train-test-eval subsets while maintaining the 80-10-10 proportion?
A)

B)
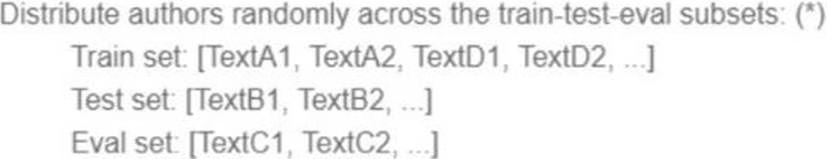

C)
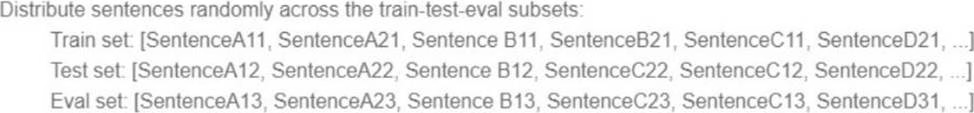

D)

- A . Option A
- B . Option B
- C . Option C
- D . Option D
C
Explanation:
The best way to distribute the training examples across the train-test-eval subsets while maintaining the 80-10-10 proportion is to use option C. This option ensures that each subset contains a balanced and representative sample of the different classes (Democrat and Republican) and the different authors. This way, the model can learn from a diverse and comprehensive set of articles and avoid overfitting or underfitting.
Option C also avoids the problem of data leakage, which occurs when the same author appears in more than one subset, potentially biasing the model and inflating its performance. Therefore, option C is the most suitable technique for this use case.
Your data science team needs to rapidly experiment with various features, model architectures, and hyperparameters. They need to track the accuracy metrics for various experiments and use an API to query the metrics over time.
What should they use to track and report their experiments while minimizing manual effort?
- A . Use Kubeflow Pipelines to execute the experiments Export the metrics file, and query the results using the Kubeflow Pipelines API.
- B . Use Al Platform Training to execute the experiments Write the accuracy metrics to BigQuery, and query the results using the BigQueryAPI.
- C . Use Al Platform Training to execute the experiments Write the accuracy metrics to Cloud Monitoring, and query the results using the Monitoring API.
- D . Use Al Platform Notebooks to execute the experiments. Collect the results in a shared Google
Sheets file, and query the results using the Google Sheets API
C
Explanation:
AI Platform Training is a service that allows you to run your machine learning experiments on Google Cloud using various features, model architectures, and hyperparameters. You can use AI Platform Training to scale up your experiments, leverage distributed training, and access specialized hardware such as GPUs and TPUs1. Cloud Monitoring is a service that collects and analyzes metrics, logs, and traces from Google Cloud, AWS, and other sources. You can use Cloud Monitoring to create dashboards, alerts, and reports based on your data2. The Monitoring API is an interface that allows you to programmatically access and manipulate your monitoring data3.
By using AI Platform Training and Cloud Monitoring, you can track and report your experiments while minimizing manual effort. You can write the accuracy metrics from your experiments to Cloud Monitoring using the AI Platform Training Python package4. You can then query the results using the Monitoring API and compare the performance of different experiments. You can also visualize the metrics in the Cloud Console or create custom dashboards and alerts5. Therefore, using AI Platform Training and Cloud Monitoring is the best option for this use case.
Reference: AI Platform Training documentation
Cloud Monitoring documentation
Monitoring API overview
Using Cloud Monitoring with AI Platform Training
Viewing evaluation metrics
You are an ML engineer at a bank that has a mobile application. Management has asked you to build an ML-based biometric authentication for the app that verifies a customer’s identity based on their fingerprint. Fingerprints are considered highly sensitive personal information and cannot be downloaded and stored into the bank databases.
Which learning strategy should you recommend to train and deploy this ML model?
- A . Differential privacy
- B . Federated learning
- C . MD5 to encrypt data
- D . Data Loss Prevention API
B
Explanation:
Federated learning is a machine learning technique that enables organizations to train AI models on decentralized data without centralizing or sharing it1. It allows data privacy, continual learning, and better performance on end-user devices2. Federated learning works by sending the model parameters to the devices, where they are updated locally on the device’s data, and then aggregating the updated parameters on a central server to form a global model3. This way, the data never leaves the device and the model can learn from a large and diverse dataset.
Federated learning is suitable for the use case of building an ML-based biometric authentication for the bank’s mobile app that verifies a customer’s identity based on their fingerprint. Fingerprints are considered highly sensitive personal information and cannot be downloaded and stored into the bank databases. By using federated learning, the bank can train and deploy an ML model that can recognize fingerprints without compromising the data privacy of the customers. The model can also adapt to the variations and changes in the fingerprints over time and improve its accuracy and reliability. Therefore, federated learning is the best learning strategy for this use case.
You are building a linear regression model on BigQuery ML to predict a customer’s likelihood of purchasing your company’s products. Your model uses a city name variable as a key predictive component. In order to train and serve the model, your data must be organized in columns. You want to prepare your data using the least amount of coding while maintaining the predictable variables.
What should you do?
- A . Create a new view with BigQuery that does not include a column with city information
- B . Use Dataprep to transform the state column using a one-hot encoding method, and make each city a column with binary values.
- C . Use Cloud Data Fusion to assign each city to a region labeled as 1, 2, 3, 4, or 5r and then use that number to represent the city in the model.
- D . Use TensorFlow to create a categorical variable with a vocabulary list Create the vocabulary file, and upload it as part of your model to BigQuery ML.
B
Explanation:
One-hot encoding is a technique that converts categorical variables into numerical variables by creating dummy variables for each possible category. Each dummy variable has a value of 1 if the original variable belongs to that category, and 0 otherwise1. One-hot encoding can help linear regression models to capture the effect of different categories on the target variable without imposing any ordinal relationship among them2. Dataprep is a service that allows you to explore,
clean, and transform your data for analysis and machine learning. You can use Dataprep to apply one-hot encoding to your city name variable and make each city a column with binary values3. This way, you can prepare your data using the least amount of coding while maintaining the predictive variables. Therefore, using Dataprep to transform the state column using a one-hot encoding method is the best option for this use case.
Reference: One Hot Encoding: A Beginner’s Guide
One-Hot Encoding in Linear Regression Models
Dataprep documentation
You work for a toy manufacturer that has been experiencing a large increase in demand. You need to build an ML model to reduce the amount of time spent by quality control inspectors checking for product defects. Faster defect detection is a priority. The factory does not have reliable Wi-Fi. Your company wants to implement the new ML model as soon as possible.
Which model should you use?
- A . AutoML Vision model
- B . AutoML Vision Edge mobile-versatile-1 model
- C . AutoML Vision Edge mobile-low-latency-1 model
- D . AutoML Vision Edge mobile-high-accuracy-1 model
C
Explanation:
AutoML Vision Edge is a service that allows you to create custom image classification and object detection models that can run on edge devices, such as mobile phones, tablets, or IoT devices1. AutoML Vision Edge offers four types of models that vary in size, accuracy, and latency:
mobile-versatile-1, mobile-low-latency-1, mobile-high-accuracy-1, and mobile-core-ml-low-latency-12. Each model has its own trade-offs and use cases, depending on the device specifications and the application requirements.
For the use case of building an ML model to reduce the amount of time spent by quality control inspectors checking for product defects, the best model to use is the AutoML Vision Edge mobile-low-latency-1 model. This model is optimized for fast inference on mobile devices, with a latency of less than 50 milliseconds on a Pixel 1 phone2. Faster defect detection is a priority for the toy manufacturer, and the factory does not have reliable Wi-Fi, so a low-latency model that can run on the device without internet connection is ideal. The mobile-low-latency-1 model also has a small size of less than 4 MB, which makes it easy to deploy and update2. The mobile-low-latency-1 model has a slightly lower accuracy than the mobile-high-accuracy-1 model, but it is still suitable for most image classification tasks2. Therefore, the AutoML Vision Edge mobile-low-latency-1 model is the best option for this use case.
Reference: AutoML Vision Edge documentation
AutoML Vision Edge model types
You are going to train a DNN regression model with Keras APIs using this code:
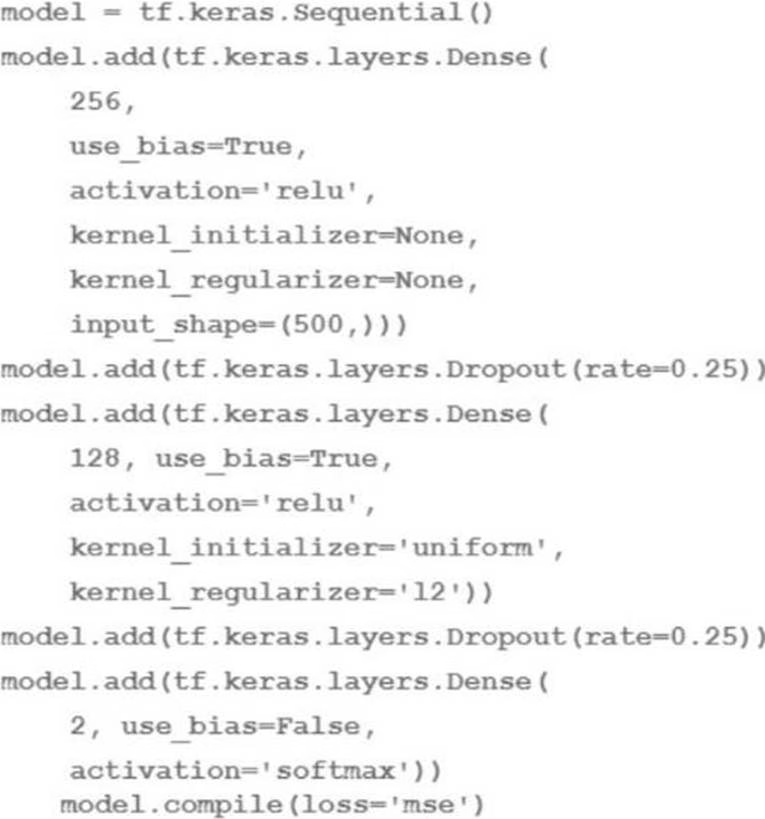

How many trainable weights does your model have? (The arithmetic below is correct.)
- A . 501*256+257*128+2 161154
- B . 500*256+256*128+128*2 161024
- C . 501*256+257*128+128*2161408
- D . 500*256*0 25+256*128*0 25+128*2 40448
B
Explanation:
The number of trainable weights in a DNN regression model with Keras APIs can be calculated by multiplying the number of input units by the number of output units for each layer, and adding the number of bias units for each layer. The bias units are usually equal to the number of output units, except for the last layer, which does not have bias units if the activation function is softmax1. In this code, the model has three layers: a dense layer with 256 units and relu activation, a dropout layer with 0.25 rate, and a dense layer with 2 units and softmax activation. The input shape is 500.
Therefore, the number of trainable weights is:
For the first layer: 500 input units * 256 output units + 256 bias units 128256
For the second layer: The dropout layer does not have any trainable weights, as it only randomly sets some of the input units to zero to prevent overfitting2.
For the third layer: 256 input units * 2 output units + 0 bias units 512
The total number of trainable weights is 128256 + 512 161024. Therefore, the correct answer is B.
Reference: How to calculate the number of parameters for a Convolutional Neural Network?
Dropout (keras.io)
You recently joined a machine learning team that will soon release a new project. As a lead on the project, you are asked to determine the production readiness of the ML components. The team has already tested features and data, model development, and infrastructure.
Which additional readiness check should you recommend to the team?
- A . Ensure that training is reproducible
- B . Ensure that all hyperparameters are tuned
- C . Ensure that model performance is monitored
- D . Ensure that feature expectations are captured in the schema
C
Explanation:
Monitoring model performance is an essential part of production readiness, as it allows the team to
detect and address any issues that may arise after deployment, such as data drift, model
degradation, or errors.
Other Options:
You recently designed and built a custom neural network that uses critical dependencies specific to your organization’s framework. You need to train the model using a managed training service on Google Cloud. However, the ML framework and related dependencies are not supported by Al Platform Training. Also, both your model and your data are too large to fit in memory on a single machine. Your ML framework of choice uses the scheduler, workers, and servers distribution structure.
What should you do?
- A . Use a built-in model available on Al Platform Training
- B . Build your custom container to run jobs on Al Platform Training
- C . Build your custom containers to run distributed training jobs on Al Platform Training
- D . Reconfigure your code to a ML framework with dependencies that are supported by Al Platform Training
C
Explanation:
AI Platform Training is a service that allows you to run your machine learning training jobs on Google Cloud using various features, model architectures, and hyperparameters. You can use AI Platform Training to scale up your training jobs, leverage distributed training, and access specialized hardware such as GPUs and TPUs1. AI Platform Training supports several pre-built containers that provide different ML frameworks and dependencies, such as TensorFlow, PyTorch, scikit-learn, and XGBoost2. However, if the ML framework and related dependencies that you need are not supported by the pre-built containers, you can build your own custom containers and use them to run your training jobs on AI Platform Training3.
Custom containers are Docker images that you create to run your training application. By using custom containers, you can specify and pre-install all the dependencies needed for your application, and have full control over the code, serving, and deployment of your model4. Custom containers also enable you to run distributed training jobs on AI Platform Training, which can help you train large-scale and complex models faster and more efficiently5. Distributed training is a technique that splits the training data and computation across multiple machines, and coordinates them to update the model parameters. AI Platform Training supports two types of distributed training: parameter server and collective all-reduce. The parameter server architecture consists of a set of workers that perform the computation, and a set of servers that store and update the model parameters. The collective all-reduce architecture consists of a set of workers that perform the computation and synchronize the model parameters among themselves. Both architectures also have a scheduler that coordinates the workers and servers.
For the use case of training a custom neural network that uses critical dependencies specific to your organization’s framework, the best option is to build your custom containers to run distributed training jobs on AI Platform Training. This option allows you to use the ML framework and dependencies of your choice, and train your model on multiple machines without having to manage the infrastructure. Since your ML framework of choice uses the scheduler, workers, and servers distribution structure, you can use the parameter server architecture to run your distributed training job on AI Platform Training. You can specify the number and type of machines, the custom container image, and the training application arguments when you submit your training job. Therefore, building your custom containers to run distributed training jobs on AI Platform Training is the best option for this use case.
Reference: AI Platform Training documentation
Pre-built containers for training
Custom containers for training
Custom containers overview | Vertex AI | Google Cloud
Distributed training overview
[Types of distributed training]
[Distributed training architectures]
[Using custom containers for training with the parameter server architecture]
You are an ML engineer in the contact center of a large enterprise. You need to build a sentiment analysis tool that predicts customer sentiment from recorded phone conversations. You need to identify the best approach to building a model while ensuring that the gender, age, and cultural differences of the customers who called the contact center do not impact any stage of the model development pipeline and results.
What should you do?
- A . Extract sentiment directly from the voice recordings
- B . Convert the speech to text and build a model based on the words
- C . Convert the speech to text and extract sentiments based on the sentences
- D . Convert the speech to text and extract sentiment using syntactical analysis
C
Explanation:
Sentiment analysis is the process of identifying and extracting the emotions, opinions, and attitudes expressed in a text or speech. Sentiment analysis can help businesses understand their customers’ feedback, satisfaction, and preferences. There are different approaches to building a sentiment analysis tool, depending on the input data and the output format.
Some of the common approaches are:
Extracting sentiment directly from the voice recordings: This approach involves using acoustic features, such as pitch, intensity, and prosody, to infer the sentiment of the speaker. This approach can capture the nuances and subtleties of the vocal expression, but it also requires a large and diverse dataset of labeled voice recordings, which may not be easily available or accessible. Moreover, this approach may not account for the semantic and contextual information of the speech, which can also affect the sentiment.
Converting the speech to text and building a model based on the words: This approach involves using automatic speech recognition (ASR) to transcribe the voice recordings into text, and then using lexical features, such as word frequency, polarity, and valence, to infer the sentiment of the text. This approach can leverage the existing text-based sentiment analysis models and tools, but it also introduces some challenges, such as the accuracy and reliability of the ASR system, the ambiguity and variability of the natural language, and the loss of the acoustic information of the speech. Converting the speech to text and extracting sentiments based on the sentences: This approach involves using ASR to transcribe the voice recordings into text, and then using syntactic and semantic features, such as sentence structure, word order, and meaning, to infer the sentiment of the text. This approach can capture the higher-level and complex aspects of the natural language, such as negation, sarcasm, and irony, which can affect the sentiment. However, this approach also requires more sophisticated and advanced natural language processing techniques, such as parsing, dependency analysis, and semantic role labeling, which may not be readily available or easy to implement.
Converting the speech to text and extracting sentiment using syntactical analysis: This approach involves using ASR to transcribe the voice recordings into text, and then using syntactical analysis, such as part-of-speech tagging, phrase chunking, and constituency parsing, to infer the sentiment of the text. This approach can identify the grammatical and structural elements of the natural language, such as nouns, verbs, adjectives, and clauses, which can indicate the sentiment. However, this approach may not account for the pragmatic and contextual information of the speech, such as the speaker’s intention, tone, and situation, which can also influence the sentiment.
For the use case of building a sentiment analysis tool that predicts customer sentiment from recorded phone conversations, the best approach is to convert the speech to text and extract sentiments based on the sentences. This approach can balance the trade-offs between the accuracy, complexity, and feasibility of the sentiment analysis tool, while ensuring that the gender, age, and cultural differences of the customers who called the contact center do not impact any stage of the model development pipeline and results. This approach can also handle different types and levels of sentiment, such as polarity (positive, negative, or neutral), intensity (strong or weak), and emotion (anger, joy, sadness, etc.). Therefore, converting the speech to text and extracting sentiments based on the sentences is the best approach for this use case.
You work for an advertising company and want to understand the effectiveness of your company’s latest advertising campaign. You have streamed 500 MB of campaign data into BigQuery. You want to query the table, and then manipulate the results of that query with a pandas dataframe in an Al Platform notebook.
What should you do?
- A . Use Al Platform Notebooks’ BigQuery cell magic to query the data, and ingest the results as a pandas dataframe
- B . Export your table as a CSV file from BigQuery to Google Drive, and use the Google Drive API to ingest the file into your notebook instance
- C . Download your table from BigQuery as a local CSV file, and upload it to your Al Platform notebook instance Use pandas. read_csv to ingest the file as a pandas dataframe
- D . From a bash cell in your Al Platform notebook, use the bq extract command to export the table as a CSV file to Cloud Storage, and then use gsutii cp to copy the data into the notebook Use pandas. read_csv to ingest the file as a pandas dataframe
A
Explanation:
AI Platform Notebooks is a service that provides managed Jupyter notebooks for data science and machine learning. You can use AI Platform Notebooks to create, run, and share your code and analysis in a collaborative and interactive environment1. BigQuery is a service that allows you to analyze large-scale and complex data using SQL queries. You can use BigQuery to stream, store, and query your data in a fast and cost-effective way2. Pandas is a popular Python library that provides data structures and tools for data analysis and manipulation. You can use pandas to create, manipulate, and visualize dataframes, which are tabular data structures with rows and columns3. AI Platform Notebooks provides a cell magic, %%bigquery, that allows you to run SQL queries on BigQuery data and ingest the results as a pandas dataframe. A cell magic is a special command that applies to the whole cell in a Jupyter notebook. The %%bigquery cell magic can take various arguments, such as the name of the destination dataframe, the name of the destination table in BigQuery, the project ID, and the query parameters4. By using the %%bigquery cell magic, you can query the data in BigQuery with minimal code and manipulate the results with pandas in AI Platform Notebooks. This is the most convenient and efficient way to achieve your goal.
The other options are not as good as option A, because they involve more steps, more code, and more manual effort.
Option B requires you to export your table as a CSV file from BigQuery to Google Drive, and then use the Google Drive API to ingest the file into your notebook instance. This option is cumbersome and time-consuming, as it involves moving the data across different services and formats.
Option C requires you to download your table from BigQuery as a local CSV file, and then upload it to your AI Platform notebook instance. This option is also inefficient and impractical, as it involves downloading and uploading large files, which can take a long time and consume a lot of bandwidth.
Option D requires you to use a bash cell in your AI Platform notebook to export the table as a CSV file to Cloud Storage, and then copy the data into the notebook. This option is also complex and unnecessary, as it involves using different commands and tools to move the data around. Therefore, option A is the best option for this use case.
Reference: AI Platform Notebooks documentation
BigQuery documentation
pandas documentation
Using Jupyter magics to query BigQuery data
You have trained a model on a dataset that required computationally expensive preprocessing operations. You need to execute the same preprocessing at prediction time. You deployed the model on Al Platform for high-throughput online prediction.
Which architecture should you use?
- A . • Validate the accuracy of the model that you trained on preprocessed data
• Create a new model that uses the raw data and is available in real time
• Deploy the new model onto Al Platform for online prediction - B . • Send incoming prediction requests to a Pub/Sub topic
• Transform the incoming data using a Dataflow job
• Submit a prediction request to Al Platform using the transformed data
• Write the predictions to an outbound Pub/Sub queue - C . • Stream incoming prediction request data into Cloud Spanner
• Create a view to abstract your preprocessing logic.
• Query the view every second for new records
• Submit a prediction request to Al Platform using the transformed data
• Write the predictions to an outbound Pub/Sub queue. - D . • Send incoming prediction requests to a Pub/Sub topic
• Set up a Cloud Function that is triggered when messages are published to the Pub/Sub topic.
• Implement your preprocessing logic in the Cloud Function
• Submit a prediction request to Al Platform using the transformed data
• Write the predictions to an outbound Pub/Sub queue
D
Explanation:
Option A is incorrect because creating a new model that uses the raw data and is available in real time would require retraining the model and deploying it again, which is not efficient or scalable.
Option B is incorrect because using a Dataflow job to transform the incoming data would introduce unnecessary latency and complexity for online prediction, which requires fast and simple processing.
Option C is incorrect because using Cloud Spanner to stream and query the incoming data would incur high costs and overhead for online prediction, which does not need a relational database.
Option D is correct because using a Cloud Function to preprocess the data and submit a prediction request to Al Platform is a simple and scalable solution for online prediction, which leverages the serverless and event-driven features of Cloud Functions.
You are building a model to predict daily temperatures. You split the data randomly and then transformed the training and test datasets. Temperature data for model training is uploaded hourly. During testing, your model performed with 97% accuracy; however, after deploying to production, the model’s accuracy dropped to 66%.
How can you make your production model more accurate?
- A . Normalize the data for the training, and test datasets as two separate steps.
- B . Split the training and test data based on time rather than a random split to avoid leakage
- C . Add more data to your test set to ensure that you have a fair distribution and sample for testing
- D . Apply data transformations before splitting, and cross-validate to make sure that the transformations are applied to both the training and test sets.
B
Explanation:
When building a model to predict daily temperatures, it is important to split the training and test data based on time rather than a random split. This is because temperature data is likely to have temporal dependencies and patterns, such as seasonality, trends, and cycles. If the data is split randomly, there is a risk of data leakage, which occurs when information from the future is used to train or validate the model. Data leakage can lead to overfitting and unrealistic performance estimates, as the model may learn from data that it should not have access to. By splitting the data based on time, such as using the most recent data as the test set and the older data as the training set, the model can be evaluated on how well it can forecast future temperatures based on past data, which is the realistic scenario in production. Therefore, splitting the data based on time rather than a random split is the best way to make the production model more accurate.
You have a demand forecasting pipeline in production that uses Dataflow to preprocess raw data prior to model training and prediction. During preprocessing, you employ Z-score normalization on data stored in BigQuery and write it back to BigQuery. New training data is added every week. You want to make the process more efficient by minimizing computation time and manual intervention.
What should you do?
- A . Normalize the data using Google Kubernetes Engine
- B . Translate the normalization algorithm into SQL for use with BigQuery
- C . Use the normalizer_fn argument in TensorFlow’s Feature Column API
- D . Normalize the data with Apache Spark using the Dataproc connector for BigQuery
B
Explanation:
Z-score normalization is a technique that transforms the values of a numeric variable into standardized units, such that the mean is zero and the standard deviation is one. Z-score normalization can help to compare variables with different scales and ranges, and to reduce the effect of outliers and skewness.
The formula for z-score normalization is:
z (x – mu) / sigma
where x is the original value, mu is the mean of the variable, and sigma is the standard deviation of the variable.
Dataflow is a service that allows you to create and run data processing pipelines on Google Cloud. You can use Dataflow to preprocess raw data prior to model training and prediction, such as applying z-score normalization on data stored in BigQuery. However, using Dataflow for this task may not be the most efficient option, as it involves reading and writing data from and to BigQuery, which can be time-consuming and costly. Moreover, using Dataflow requires manual intervention to update the pipeline whenever new training data is added.
A more efficient way to perform z-score normalization on data stored in BigQuery is to translate the normalization algorithm into SQL and use it with BigQuery. BigQuery is a service that allows you to analyze large-scale and complex data using SQL queries. You can use BigQuery to perform z-score normalization on your data using SQL functions such as AVG(), STDDEV_POP(), and OVER(). For example, the following SQL query can normalize the values of a column called temperature in a table called weather:
SELECT (temperature – AVG(temperature) OVER ()) / STDDEV_POP(temperature) OVER () AS normalized_temperature FROM weather;
By using SQL to perform z-score normalization on BigQuery, you can make the process more efficient by minimizing computation time and manual intervention. You can also leverage the scalability and performance of BigQuery to handle large and complex datasets. Therefore, translating the normalization algorithm into SQL for use with BigQuery is the best option for this use case.
You were asked to investigate failures of a production line component based on sensor readings. After receiving the dataset, you discover that less than 1% of the readings are positive examples representing failure incidents. You have tried to train several classification models, but none of them converge.
How should you resolve the class imbalance problem?
- A . Use the class distribution to generate 10% positive examples
- B . Use a convolutional neural network with max pooling and softmax activation
- C . Downsample the data with upweighting to create a sample with 10% positive examples
- D . Remove negative examples until the numbers of positive and negative examples are equal
C
Explanation:
The class imbalance problem is a common challenge in machine learning, especially in classification tasks. It occurs when the distribution of the target classes is highly skewed, such that one class (the majority class) has much more examples than the other class (the minority class). The minority class is often the more interesting or important class, such as failure incidents, fraud cases, or rare diseases. However, most machine learning algorithms are designed to optimize the overall accuracy, which can be biased towards the majority class and ignore the minority class. This can result in poor predictive performance, especially for the minority class.
There are different techniques to deal with the class imbalance problem, such as data-level methods, algorithm-level methods, and evaluation-level methods1. Data-level methods involve resampling the original dataset to create a more balanced class distribution. There are two main types of data-level methods: oversampling and undersampling. Oversampling methods increase the number of examples in the minority class, either by duplicating existing examples or by generating synthetic examples. Undersampling methods reduce the number of examples in the majority class, either by randomly removing examples or by using clustering or other criteria to select representative examples. Both oversampling and undersampling methods can be combined with upweighting or downweighting, which assign different weights to the examples according to their class frequency, to further balance the dataset.
For the use case of investigating failures of a production line component based on sensor readings, the best option is to downsample the data with upweighting to create a sample with 10% positive examples. This option involves randomly removing some of the negative examples (the majority class) until the ratio of positive to negative examples is 1:9, and then assigning higher weights to the positive examples to compensate for their low frequency. This option can create a more balanced dataset that can improve the performance of the classification models, while preserving the diversity and representativeness of the original data. This option can also reduce the computation time and memory usage, as the size of the dataset is reduced. Therefore, downsampling the data with upweighting to create a sample with 10% positive examples is the best option for this use case.
Reference: A Systematic Study of the Class Imbalance Problem in Convolutional Neural Networks
You need to design a customized deep neural network in Keras that will predict customer purchases based on their purchase history. You want to explore model performance using multiple model architectures, store training data, and be able to compare the evaluation metrics in the same dashboard.
What should you do?
- A . Create multiple models using AutoML Tables
- B . Automate multiple training runs using Cloud Composer
- C . Run multiple training jobs on Al Platform with similar job names
- D . Create an experiment in Kubeflow Pipelines to organize multiple runs
D
Explanation:
Kubeflow Pipelines is a service that allows you to create and run machine learning workflows on Google Cloud using various features, model architectures, and hyperparameters. You can use Kubeflow Pipelines to scale up your workflows, leverage distributed training, and access specialized hardware such as GPUs and TPUs1. An experiment in Kubeflow Pipelines is a workspace where you can try different configurations of your pipelines and organize your runs into logical groups. You can use experiments to compare the performance of different models and track the evaluation metrics in the same dashboard2.
For the use case of designing a customized deep neural network in Keras that will predict customer purchases based on their purchase history, the best option is to create an experiment in Kubeflow Pipelines to organize multiple runs. This option allows you to explore model performance using multiple model architectures, store training data, and compare the evaluation metrics in the same dashboard. You can use Keras to build and train your deep neural network models, and then package them as pipeline components that can be reused and combined with other components. You can also use Kubeflow Pipelines SDK to define and submit your pipelines programmatically, and use Kubeflow Pipelines UI to monitor and manage your experiments. Therefore, creating an experiment in Kubeflow Pipelines to organize multiple runs is the best option for this use case.
Reference: Kubeflow Pipelines documentation
Experiment | Kubeflow
Your team needs to build a model that predicts whether images contain a driver’s license, passport, or credit card. The data engineering team already built the pipeline and generated a dataset composed of 10,000 images with driver’s licenses, 1,000 images with passports, and 1,000 images with credit cards. You now have to train a model with the following label map: [‘driversjicense’, ‘passport’, ‘credit_card’].
Which loss function should you use?
- A . Categorical hinge
- B . Binary cross-entropy
- C . Categorical cross-entropy
- D . Sparse categorical cross-entropy
C
Explanation:
Categorical cross-entropy is a loss function that is suitable for multi-class classification problems, where the target variable has more than two possible values. Categorical cross-entropy measures the difference between the true probability distribution of the target classes and the predicted probability distribution of the model. It is defined as: L – sum(y_i * log(p_i))
where y_i is the true probability of class i, and p_i is the predicted probability of class i. Categorical cross-entropy penalizes the model for making incorrect predictions, and encourages the model to assign high probabilities to the correct classes and low probabilities to the incorrect classes. For the use case of building a model that predicts whether images contain a driver’s license, passport, or credit card, categorical cross-entropy is the appropriate loss function to use. This is because the problem is a multi-class classification problem, where the target variable has three possible values: [‘drivers_license’, ‘passport’, ‘credit_card’]. The label map is a list that maps the class names to the class indices, such that ‘drivers_license’ corresponds to index 0, ‘passport’ corresponds to index 1, and ‘credit_card’ corresponds to index 2. The model should output a probability distribution over the three classes for each image, and the categorical cross-entropy loss function should compare the output with the true labels. Therefore, categorical cross-entropy is the best loss function for this use case.
You are an ML engineer at a global car manufacturer. You need to build an ML model to predict car sales in different cities around the world.
Which features or feature crosses should you use to train city-specific relationships between car type and number of sales?
- A . Three individual features binned latitude, binned longitude, and one-hot encoded car type
- B . One feature obtained as an element-wise product between latitude, longitude, and car type
- C . One feature obtained as an element-wise product between binned latitude, binned longitude, and one-hot encoded car type
- D . Two feature crosses as a element-wise product the first between binned latitude and one-hot encoded car type, and the second between binned longitude and one-hot encoded car type
C
Explanation:
A feature cross is a synthetic feature that is obtained by combining two or more existing features, usually by taking their product or concatenation. A feature cross can help to capture the nonlinear and interaction effects between the original features, and improve the predictive performance of the model. A feature cross can be applied to different types of features, such as numeric, categorical, or geospatial features1.
For the use case of building an ML model to predict car sales in different cities around the world, the best option is to use one feature obtained as an element-wise product between binned latitude, binned longitude, and one-hot encoded car type. This option involves creating a feature cross that combines three individual features: binned latitude, binned longitude, and one-hot encoded car type. Binning is a technique that transforms a continuous numeric feature into a discrete categorical feature by dividing its range into equal intervals, or bins. One-hot encoding is a technique that transforms a categorical feature into a binary vector, where each element corresponds to a possible category, and has a value of 1 if the feature belongs to that category, and 0 otherwise. By applying binning and one-hot encoding to the latitude, longitude, and car type features, the feature cross can capture the city-specific relationships between car type and number of sales, as each combination of bins and car types can represent a different city and its preference for a certain car type. For example, the feature cross can learn that a city with a latitude bin of [40, 50], a longitude bin of [-80, -70], and a car type of SUV has a higher number of sales than a city with a latitude bin of [-10, 0], a longitude bin of [10, 20], and a car type of sedan. Therefore, using one feature obtained as an element-wise product between binned latitude, binned longitude, and one-hot encoded car type is the best option for this use case.
Reference: Feature Crosses | Machine Learning Crash Course
You trained a text classification model.
You have the following SignatureDefs:
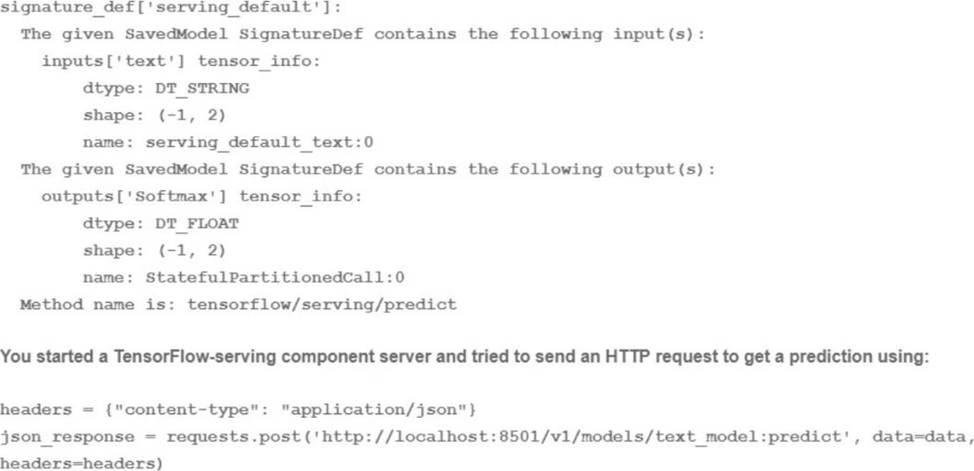

What is the correct way to write the predict request?
- A . data json.dumps({"signature_name": "serving_default’ "instances": [fab’, ‘be1, ‘cd’]]})
- B . data json dumps({"signature_name": "serving_default"! "instances": [[‘a’, ‘b’, "c", ‘d’, ‘e’, ‘f’]]})
- C . data json.dumps({"signature_name": "serving_default, "instances": [[‘a’, ‘b ‘c’1, [d ‘e T]]})
- D . data json dumps({"signature_name": f,serving_default", "instances": [[‘a’, ‘b’], [c ‘d’], [‘e T]]})
D
Explanation:
A predict request is a way to send data to a trained model and get predictions in return. A predict request can be written in different formats, such as JSON, protobuf, or gRPC, depending on the service and the platform that are used to host and serve the model.
A predict request usually contains the following information:
The signature name: This is the name of the signature that defines the inputs and outputs of the model. A signature is a way to specify the expected format, type, and shape of the data that the model can accept and produce. A signature can be specified when exporting or saving the model, or it can be automatically inferred by the service or the platform. A model can have multiple signatures, but only one can be used for each predict request.
The instances: This is the data that is sent to the model for prediction. The instances can be a single instance or a batch of instances, depending on the size and shape of the data. The instances should match the input specification of the signature, such as the number, name, and type of the input tensors.
For the use case of training a text classification model, the correct way to write the predict request is
D. data json.dumps({“signature_name”: “serving_default”, “instances”: [[‘a’, ‘b’], [‘c’, ‘d’], [‘e’, ‘f’]]}) This option involves writing the predict request in JSON format, which is a common and convenient format for sending and receiving data over the web. JSON stands for JavaScript Object Notation, and it is a way to represent data as a collection of name-value pairs or an ordered list of values. JSON can be easily converted to and from Python objects using the json module.
This option also involves using the signature name “serving_default”, which is the default signature name that is assigned to the model when it is saved or exported without specifying a custom signature name. The serving_default signature defines the input and output tensors of the model based on the SignatureDef that is shown in the image. According to the SignatureDef, the model expects an input tensor called “text” that has a shape of (-1, 2) and a type of DT_STRING, and produces an output tensor called “softmax” that has a shape of (-1, 2) and a type of DT_FLOAT. The -1 in the shape indicates that the dimension can vary depending on the number of instances, and the 2 indicates that the dimension is fixed at 2. The DT_STRING and DT_FLOAT indicate that the data type is string and float, respectively.
This option also involves sending a batch of three instances to the model for prediction. Each instance is a list of two strings, such as [‘a’, ‘b’], [‘c’, ‘d’], or [‘e’, ‘f’]. These instances match the input specification of the signature, as they have a shape of (3, 2) and a type of string. The model will process these instances and produce a batch of three predictions, each with a softmax output that has a shape of (1, 2) and a type of float. The softmax output is a probability distribution over the two possible classes that the model can predict, such as positive or negative sentiment.
Therefore, writing the predict request as data json.dumps({“signature_name”: “serving_default”, “instances”: [[‘a’, ‘b’], [‘c’, ‘d’], [‘e’, ‘f’]]}) is the correct and valid way to send data to the text classification model and get predictions in return.
Reference: [json ― JSON encoder and decoder]
You work for a social media company. You need to detect whether posted images contain cars. Each training example is a member of exactly one class. You have trained an object detection neural network and deployed the model version to Al Platform Prediction for evaluation. Before deployment, you created an evaluation job and attached it to the Al Platform Prediction model version. You notice that the precision is lower than your business requirements allow.
How should you adjust the model’s final layer softmax threshold to increase precision?
- A . Increase the recall
- B . Decrease the recall.
- C . Increase the number of false positives
- D . Decrease the number of false negatives
B
Explanation:
Precision and recall are two common metrics for evaluating the performance of a classification model. Precision measures the proportion of positive predictions that are correct, while recall measures the proportion of positive examples that are correctly predicted. Precision and recall are inversely related, meaning that increasing one will decrease the other, and vice versa. The trade-off between precision and recall depends on the goal and the cost of the classification problem1.
For the use case of detecting whether posted images contain cars, precision is more important than recall, as the social media company wants to minimize the number of false positives, or images that are incorrectly labeled as containing cars. A high precision means that the model is confident and accurate in its positive predictions, while a low recall means that the model may miss some positive examples, or images that actually contain cars. The cost of missing some positive examples is lower than the cost of making wrong positive predictions, as the latter may affect the user experience and the reputation of the social media company.
The softmax function is a function that transforms a vector of real numbers into a probability distribution over the possible classes. The softmax function is often used as the final layer of a neural network for multi-class classification problems, as it assigns a probability to each class, and the class with the highest probability is chosen as the prediction. The softmax function is defined as: softmax (x_i) exp (x_i) / sum_j exp (x_j)
where x_i is the input value for class i, and softmax (x_i) is the output probability for class i.
The softmax threshold is a parameter that determines the minimum probability that a class must have to be chosen as the prediction. For example, if the softmax threshold is 0.5, then the class with the highest probability must have at least 0.5 to be selected, otherwise the prediction is none. The softmax threshold can be used to adjust the trade-off between precision and recall, as a higher threshold will increase the precision and decrease the recall, while a lower threshold will decrease the precision and increase the recall2.
For the use case of detecting whether posted images contain cars, the best way to adjust the model’s final layer softmax threshold to increase precision is to decrease the recall. This means that the softmax threshold should be increased, so that the model will only make positive predictions when it is highly confident, and avoid making false positives. By increasing the softmax threshold, the model will become more selective and accurate in its positive predictions, and improve the precision metric. Therefore, decreasing the recall is the best option for this use case.
Reference: Precision and recall – Wikipedia
How to add a threshold in softmax scores – Stack Overflow
You developed an ML model with Al Platform, and you want to move it to production. You serve a few thousand queries per second and are experiencing latency issues. Incoming requests are served by a load balancer that distributes them across multiple Kubeflow CPU-only pods running on Google Kubernetes Engine (GKE). Your goal is to improve the serving latency without changing the underlying infrastructure.
What should you do?
- A . Significantly increase the max_batch_size TensorFlow Serving parameter
- B . Switch to the tensorflow-model-server-universal version of TensorFlow Serving
- C . Significantly increase the max_enqueued_batches TensorFlow Serving parameter
- D . Recompile TensorFlow Serving using the source to support CPU-specific optimizations Instruct GKE to choose an appropriate baseline minimum CPU platform for serving nodes
D
Explanation:
TensorFlow Serving is a service that allows you to deploy and serve TensorFlow models in a scalable and efficient way. TensorFlow Serving supports various platforms and hardware, such as CPU, GPU, and TPU. However, the default TensorFlow Serving binaries are built with generic CPU instructions, which may not leverage the full potential of the CPU architecture. To improve the serving latency and performance, you can recompile TensorFlow Serving using the source code and enable CPU-specific optimizations, such as AVX, AVX2, and FMA1. These optimizations can speed up the computation and inference of the TensorFlow models, especially for deep neural networks.
Google Kubernetes Engine (GKE) is a service that allows you to run and manage containerized applications on Google Cloud using Kubernetes. GKE supports various types and sizes of nodes, which are the virtual machines that run the containers. GKE also supports different CPU platforms, which are the generations and models of the CPUs that power the nodes. GKE allows you to choose a baseline minimum CPU platform for your node pool, which is a group of nodes with the same configuration. By choosing a baseline minimum CPU platform, you can ensure that your nodes have the CPU features and capabilities that match your workload requirements2.
For the use case of serving a few thousand queries per second and experiencing latency issues, the best option is to recompile TensorFlow Serving using the source to support CPU-specific optimizations, and instruct GKE to choose an appropriate baseline minimum CPU platform for serving nodes. This option can improve the serving latency and performance without changing the underlying infrastructure, as it only involves rebuilding the TensorFlow Serving binary and selecting the CPU platform for the GKE nodes. This option can also take advantage of the CPU-only pods that are running on GKE, as it can optimize the CPU utilization and efficiency. Therefore, recompiling TensorFlow Serving using the source to support CPU-specific optimizations and instructing GKE to choose an appropriate baseline minimum CPU platform for serving nodes is the best option for this use case.
Reference: Building TensorFlow Serving from source
Specifying a minimum CPU platform for a node pool
You built and manage a production system that is responsible for predicting sales numbers. Model accuracy is crucial, because the production model is required to keep up with market changes. Since being deployed to production, the model hasn’t changed; however the accuracy of the model has steadily deteriorated.
What issue is most likely causing the steady decline in model accuracy?
- A . Poor data quality
- B . Lack of model retraining
- C . Too few layers in the model for capturing information
- D . Incorrect data split ratio during model training, evaluation, validation, and test
B
Explanation:
Model retraining is the process of updating an existing machine learning model with new data and parameters to improve its performance and accuracy. Model retraining is essential for maintaining the relevance and validity of the model, especially when the data or the environment changes over time. Model retraining can help to avoid or reduce the effects of model degradation, which is the phenomenon of the model’s predictive performance decreasing as it is tested on new datasets within rapidly evolving environments1.
For the use case of predicting sales numbers, model accuracy is crucial, because the production model is required to keep up with market changes. Market changes can affect the demand, supply, price, and preference of the products, and thus influence the sales numbers. If the model is not retrained with new data that reflects the market changes, it may become outdated and inaccurate, and fail to capture the patterns and trends of the sales numbers. Therefore, the most likely issue that is causing the steady decline in model accuracy is the lack of model retraining.
The other options are not as likely as option B, because they are not directly related to the model’s ability to adapt to market changes.
Option A, poor data quality, may affect the model’s accuracy, but it is not a specific cause of model degradation over time.
Option C, too few layers in the model for capturing information, may affect the model’s complexity and expressiveness, but it is not a specific cause of model degradation over time.
Option D, incorrect data split ratio during model training, evaluation, validation, and test, may affect the model’s generalization and validation, but it is not a specific cause of model degradation over time. Therefore, option B, lack of model retraining, is the best answer for this question.
Reference: Beware Steep Decline: Understanding Model Degradation In Machine Learning Models
You are an ML engineer at a large grocery retailer with stores in multiple regions. You have been asked to create an inventory prediction model. Your models features include region, location, historical demand, and seasonal popularity. You want the algorithm to learn from new inventory data on a daily basis.
Which algorithms should you use to build the model?
- A . Classification
- B . Reinforcement Learning
- C . Recurrent Neural Networks (RNN)
- D . Convolutional Neural Networks (CNN)
B
Explanation:
Reinforcement learning is a machine learning technique that enables an agent to learn from its own actions and feedback in an environment. Reinforcement learning does not require labeled data or explicit rules, but rather relies on trial and error and reward and punishment mechanisms to optimize the agent’s behavior and achieve a goal. Reinforcement learning can be used to solve complex and dynamic problems that involve sequential decision making and adaptation to changing situations1.
For the use case of creating an inventory prediction model for a large grocery retailer with stores in multiple regions, reinforcement learning is a suitable algorithm to use. This is because the problem involves multiple factors that affect the inventory demand, such as region, location, historical demand, and seasonal popularity, and the inventory manager needs to make optimal decisions on how much and when to order, store, and distribute the products. Reinforcement learning can help the inventory manager to learn from the new inventory data on a daily basis, and adjust the inventory policy accordingly. Reinforcement learning can also handle the uncertainty and variability of the inventory demand, and balance the trade-off between overstocking and understocking2.
The other options are not as suitable as option B, because they are not designed to handle sequential decision making and adaptation to changing situations.
Option A, classification, is a machine learning
technique that assigns a label to an input based on predefined categories. Classification can be used to predict the inventory demand for a single product or a single period, but it cannot optimize the inventory policy over multiple products and periods.
Option C, recurrent neural networks (RNN), are a type of neural network that can process sequential data, such as text, speech, or time series. RNN can be used to model the temporal patterns and dependencies of the inventory demand, but they cannot learn from feedback and rewards.
Option D, convolutional neural networks (CNN), are a type of neural network that can process spatial data, such as images, videos, or graphs. CNN can be used to extract features and patterns from the inventory data, but they cannot optimize the inventory policy over multiple actions and states. Therefore, option B, reinforcement learning, is the best answer for this question.
Reference: Reinforcement learning – Wikipedia
Reinforcement Learning for Inventory Optimization
You need to train a computer vision model that predicts the type of government ID present in a given image using a GPU-powered virtual machine on Compute Engine.
You use the following parameters:
• Optimizer: SGD
• Image shape 224×224
• Batch size 64
• Epochs 10
• Verbose 2
During training you encounter the following error: ResourceExhaustedError: out of Memory (oom) when allocating tensor.
What should you do?
- A . Change the optimizer
- B . Reduce the batch size
- C . Change the learning rate
- D . Reduce the image shape
B
Explanation:
A ResourceExhaustedError: out of memory (OOM) when allocating tensor is an error that occurs when the GPU runs out of memory while trying to allocate memory for a tensor. A tensor is a multi-dimensional array of numbers that represents the data or the parameters of a machine learning model. The size and shape of a tensor depend on various factors, such as the input data, the model architecture, the batch size, and the optimization algorithm1.
For the use case of training a computer vision model that predicts the type of government ID present in a given image using a GPU-powered virtual machine on Compute Engine, the best option to resolve the error is to reduce the batch size. The batch size is a parameter that determines how many input examples are processed at a time by the model. A larger batch size can improve the model’s accuracy and stability, but it also requires more memory and computation. A smaller batch size can reduce the memory and computation requirements, but it may also affect the model’s performance and convergence2.
By reducing the batch size, the GPU can allocate less memory for each tensor, and avoid running out of memory. Reducing the batch size can also speed up the training process, as the GPU can process more batches in parallel. However, reducing the batch size too much may also have some drawbacks, such as increasing the noise and variance of the gradient updates, and slowing down the convergence of the model. Therefore, the optimal batch size should be chosen based on the trade-off between memory, computation, and performance3.
The other options are not as effective as option B, because they are not directly related to the memory allocation of the GPU.
Option A, changing the optimizer, may affect the speed and quality of the optimization process, but it may not reduce the memory usage of the model.
Option C, changing the learning rate, may affect the convergence and stability of the model, but it may not reduce the memory usage of the model.
Option D, reducing the image shape, may reduce the size of the input tensor, but it may also reduce the quality and resolution of the image, and affect the model’s accuracy. Therefore, option B, reducing the batch size, is the best answer for this question.
Reference: ResourceExhaustedError: OOM when allocating tensor with shape – Stack Overflow
How does batch size affect model performance and training time? – Stack Overflow
How to choose an optimal batch size for training a neural network? – Stack Overflow
You have been asked to develop an input pipeline for an ML training model that processes images from disparate sources at a low latency. You discover that your input data does not fit in memory.
How should you create a dataset following Google-recommended best practices?
- A . Create a tf.data.Dataset.prefetch transformation
- B . Convert the images to tf .Tensor Objects, and then run Dataset. from_tensor_slices{).
- C . Convert the images to tf .Tensor Objects, and then run tf. data. Dataset. from_tensors ().
- D . Convert the images Into TFRecords, store the images in Cloud Storage, and then use the tf. data API to read the images for training
D
Explanation:
An input pipeline is a way to prepare and feed data to a machine learning model for training or inference. An input pipeline typically consists of several steps, such as reading, parsing, transforming, batching, and prefetching the data. An input pipeline can improve the performance and efficiency of the model, as it can handle large and complex datasets, optimize the data processing, and reduce the latency and memory usage1.
For the use case of developing an input pipeline for an ML training model that processes images from disparate sources at a low latency, the best option is to convert the images into TFRecords, store the images in Cloud Storage, and then use the tf.data API to read the images for training.
This option involves using the following components and techniques:
TFRecords: TFRecords is a binary file format that can store a sequence of data records, such as images, text, or audio. TFRecords can help to compress, serialize, and store the data efficiently, and reduce the data loading and parsing time. TFRecords can also support data sharding and interleaving, which can improve the data throughput and parallelism2.
Cloud Storage: Cloud Storage is a service that allows you to store and access data on Google Cloud. Cloud Storage can help to store and manage large and distributed datasets, such as images from different sources, and provide high availability, durability, and scalability. Cloud Storage can also integrate with other Google Cloud services, such as Compute Engine, AI Platform, and Dataflow3. tf.data API: tf.data API is a set of tools and methods that allow you to create and manipulate data pipelines in TensorFlow. tf.data API can help to read, transform, batch, and prefetch the data efficiently, and optimize the data processing for performance and memory. tf.data API can also support various data sources and formats, such as TFRecords, CSV, JSON, and images.
By using these components and techniques, the input pipeline can process large datasets of images from disparate sources that do not fit in memory, and provide low latency and high performance for the ML training model. Therefore, converting the images into TFRecords, storing the images in Cloud Storage, and using the tf.data API to read the images for training is the best option for this use case.
Reference: Build TensorFlow input pipelines | TensorFlow Core
TFRecord and tf.Example | TensorFlow Core
Cloud Storage documentation | Google Cloud
[tf.data: Build TensorFlow input pipelines | TensorFlow Core]
You are building an ML model to detect anomalies in real-time sensor data. You will use Pub/Sub to handle incoming requests. You want to store the results for analytics and visualization.
How should you configure the pipeline?
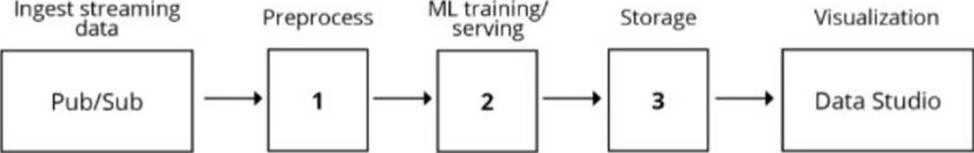

- A . 1 Dataflow, 2 – Al Platform, 3 BigQuery
- B . 1 DataProc, 2 AutoML, 3 Cloud Bigtable
- C . 1 BigQuery, 2 AutoML, 3 Cloud Functions
- D . 1 BigQuery, 2 Al Platform, 3 Cloud Storage
A
Explanation:
Dataflow is a fully managed service for executing Apache Beam pipelines that can process streaming or batch data1.
Al Platform is a unified platform that enables you to build and run machine learning applications across Google Cloud2.
BigQuery is a serverless, highly scalable, and cost-effective cloud data warehouse designed for business agility3.
These services are suitable for building an ML model to detect anomalies in real-time sensor data, as they can handle large-scale data ingestion, preprocessing, training, serving, storage, and visualization.
The other options are not as suitable because:
DataProc is a service for running Apache Spark and Apache Hadoop clusters, which are not optimized for streaming data processing4.
AutoML is a suite of machine learning products that enables developers with limited machine learning expertise to train high-quality models specific to their business needs5. However, it does not support custom models or real-time predictions.
Cloud Bigtable is a scalable, fully managed NoSQL database service for large analytical and operational workloads. However, it is not designed for ad hoc queries or interactive analysis. Cloud Functions is a serverless execution environment for building and connecting cloud services. However, it is not suitable for storing or visualizing data.
Cloud Storage is a service for storing and accessing data on Google Cloud. However, it is not a data warehouse and does not support SQL queries or visualization tools.
You have a functioning end-to-end ML pipeline that involves tuning the hyperparameters of your ML model using Al Platform, and then using the best-tuned parameters for training. Hypertuning is taking longer than expected and is delaying the downstream processes. You want to speed up the tuning job without significantly compromising its effectiveness.
Which actions should you take? Choose 2 answers
- A . Decrease the number of parallel trials
- B . Decrease the range of floating-point values
- C . Set the early stopping parameter to TRUE
- D . Change the search algorithm from Bayesian search to random search.
- E . Decrease the maximum number of trials during subsequent training phases.
C, E
Explanation:
Hyperparameter tuning is the process of finding the optimal values for the parameters of a machine learning model that affect its performance. AI Platform provides a service for hyperparameter tuning that can run multiple trials in parallel and use different search algorithms to find the best combination of hyperparameters. However, hyperparameter tuning can be time-consuming and costly, especially if the search space is large and the model training is complex. Therefore, it is important to optimize the tuning job to reduce the time and resources required.
One way to speed up the tuning job is to set the early stopping parameter to TRUE. This means that the tuning service will automatically stop trials that are unlikely to perform well based on the intermediate results. This can save time and resources by avoiding unnecessary computations for trials that are not promising. The early stopping parameter can be set in the trainingInput.hyperparameters field of the training job request1
Another way to speed up the tuning job is to decrease the maximum number of trials during subsequent training phases. This means that the tuning service will use fewer trials to refine the search space after the initial phase. This can reduce the time required for the tuning job to converge to the optimal solution. The maximum number of trials can be set in the trainingInput.hyperparameters.maxTrials field of the training job request1
The other options are not effective ways to speed up the tuning job. Decreasing the number of parallel trials will reduce the concurrency of the tuning job and increase the overall time required. Decreasing the range of floating-point values will reduce the diversity of the search space and may miss some optimal solutions. Changing the search algorithm from Bayesian search to random search will reduce the efficiency of the tuning job and may require more trials to find the best solution1
References: 1: Hyperparameter tuning overview
You have written unit tests for a Kubeflow Pipeline that require custom libraries. You want to automate the execution of unit tests with each new push to your development branch in Cloud Source Repositories.
What should you do?
- A . Write a script that sequentially performs the push to your development branch and executes the unit tests on Cloud Run
- B . Using Cloud Build, set an automated trigger to execute the unit tests when changes are pushed to your development branch.
- C . Set up a Cloud Logging sink to a Pub/Sub topic that captures interactions with Cloud Source Repositories Configure a Pub/Sub trigger for Cloud Run, and execute the unit tests on Cloud Run.
- D . Set up a Cloud Logging sink to a Pub/Sub topic that captures interactions with Cloud Source Repositories. Execute the unit tests using a Cloud Function that is triggered when messages are sent to the Pub/Sub topic
B
Explanation:
Cloud Build is a service that executes your builds on Google Cloud Platform infrastructure. Cloud Build can import source code from Cloud Source Repositories, Cloud Storage, GitHub, or Bitbucket, execute a build to your specifications, and produce artifacts such as Docker containers or Java archives1 Cloud Build allows you to set up automated triggers that start a build when changes are pushed to a source code repository. You can configure triggers to filter the changes based on the branch, tag, or file path2
To automate the execution of unit tests for a Kubeflow Pipeline that require custom libraries, you can use Cloud Build to set an automated trigger to execute the unit tests when changes are pushed to your development branch in Cloud Source Repositories. You can specify the steps of the build in a YAML or JSON file, such as installing the custom libraries, running the unit tests, and reporting the results. You can also use Cloud Build to build and deploy the Kubeflow Pipeline components if the unit tests pass3. The other options are not recommended or feasible. Writing a script that sequentially performs the push to your development branch and executes the unit tests on Cloud Run is not a good practice, as it does not leverage the benefits of Cloud Build and its integration with Cloud Source Repositories. Setting up a Cloud Logging sink to a Pub/Sub topic that captures interactions with Cloud Source Repositories and using a Pub/Sub trigger for Cloud Run or Cloud Function to execute the unit tests is unnecessarily complex and inefficient, as it adds extra steps and latency to the process. Cloud Run and Cloud Function are also not designed for executing unit tests, as they have limitations on the memory, CPU, and execution time45
Reference: 1: Cloud Build overview 2: Creating and managing build triggers 3: Building and deploying Kubeflow Pipelines using Cloud Build 4: Cloud Run documentation 5: Cloud Functions documentation
You have trained a deep neural network model on Google Cloud. The model has low loss on the training data, but is performing worse on the validation data. You want the model to be resilient to overfitting.
Which strategy should you use when retraining the model?
- A . Apply a dropout parameter of 0 2, and decrease the learning rate by a factor of 10
- B . Apply a L2 regularization parameter of 0.4, and decrease the learning rate by a factor of 10.
- C . Run a hyperparameter tuning job on Al Platform to optimize for the L2 regularization and dropout parameters
- D . Run a hyperparameter tuning job on Al Platform to optimize for the learning rate, and increase the number of neurons by a factor of 2.
C
Explanation:
Overfitting occurs when a model tries to fit the training data so closely that it does not generalize well to new data. Overfitting can be caused by having a model that is too complex for the data, such as having too many parameters or layers. Overfitting can lead to poor performance on the validation data, which reflects how the model will perform on unseen data1
To prevent overfitting, one strategy is to use regularization techniques that penalize the complexity of the model and encourage it to learn simpler patterns. Two common regularization techniques for deep neural networks are L2 regularization and dropout. L2 regularization adds a term to the loss function that is proportional to the squared magnitude of the model’s weights. This term penalizes large weights and encourages the model to use smaller weights. Dropout randomly drops out some units in the network during training, which prevents co-adaptation of features and reduces the effective number of parameters. Both L2 regularization and dropout have hyperparameters that control the strength of the regularization effect23
Another strategy to prevent overfitting is to use hyperparameter tuning, which is the process of finding the optimal values for the parameters of the model that affect its performance. Hyperparameter tuning can help find the best combination of hyperparameters that minimize the validation loss and improve the generalization ability of the model. AI Platform provides a service for hyperparameter tuning that can run multiple trials in parallel and use different search algorithms to find the best solution.
Therefore, the best strategy to use when retraining the model is to run a hyperparameter tuning job on AI Platform to optimize for the L2 regularization and dropout parameters. This will allow the model to find the optimal balance between fitting the training data and generalizing to new data. The other options are not as effective, as they either use fixed values for the regularization parameters, which may not be optimal, or they do not address the issue of overfitting at all.
References: 1: Generalization: Peril of Overfitting 2: Regularization for Deep Learning 3: Dropout: A Simple Way to Prevent Neural Networks from Overfitting: [Hyperparameter tuning overview]
You are training a Resnet model on Al Platform using TPUs to visually categorize types of defects in automobile engines. You capture the training profile using the Cloud TPU profiler plugin and observe that it is highly input-bound. You want to reduce the bottleneck and speed up your model training process.
Which modifications should you make to the tf .data dataset? Choose 2 answers
- A . Use the interleave option for reading data
- B . Reduce the value of the repeat parameter
- C . Increase the buffer size for the shuffle option.
- D . Set the prefetch option equal to the training batch size
- E . Decrease the batch size argument in your transformation
A, D
Explanation:
The tf.data dataset is a TensorFlow API that provides a way to create and manipulate data pipelines for machine learning. The tf.data dataset allows you to apply various transformations to the data, such as reading, shuffling, batching, prefetching, and interleaving. These transformations can affect the performance and efficiency of the model training process1
One of the common performance issues in model training is input-bound, which means that the model is waiting for the input data to be ready and is not fully utilizing the computational resources. Input-bound can be caused by slow data loading, insufficient parallelism, or large data size. Input-bound can be detected by using the Cloud TPU profiler plugin, which is a tool that helps you analyze the performance of your model on Cloud TPUs. The Cloud TPU profiler plugin can show you the percentage of time that the TPU cores are idle, which indicates input-bound2
To reduce the input-bound bottleneck and speed up the model training process, you can make some modifications to the tf.data dataset.
Two of the modifications that can help are:
Use the interleave option for reading data. The interleave option allows you to read data from multiple files in parallel and interleave their records. This can improve the data loading speed and reduce the idle time of the TPU cores. The interleave option can be applied by using
the tf.data.Dataset.interleave method, which takes a function that returns a dataset for each input element, and a number of parallel calls3
Set the prefetch option equal to the training batch size. The prefetch option allows you to prefetch the next batch of data while the current batch is being processed by the model. This can reduce the latency between batches and improve the throughput of the model training. The prefetch option can be applied by using the tf.data.Dataset.prefetch method, which takes a buffer size argument. The buffer size should be equal to the training batch size, which is the number of examples per batch4. The other options are not effective or counterproductive. Reducing the value of the repeat parameter will reduce the number of epochs, which is the number of times the model sees the entire dataset. This can affect the model’s accuracy and convergence. Increasing the buffer size for the shuffle option will increase the randomness of the data, but also increase the memory usage and the data loading time. Decreasing the batch size argument in your transformation will reduce the number of examples per batch, which can affect the model’s stability and performance.
Reference: 1: tf.data: Build TensorFlow input pipelines 2: Cloud TPU Tools in TensorBoard 3: tf.data.Dataset.interleave 4: tf.data.Dataset.prefetch: [Better performance with the tf.data API]
You work for a public transportation company and need to build a model to estimate delay times for multiple transportation routes. Predictions are served directly to users in an app in real time. Because different seasons and population increases impact the data relevance, you will retrain the model every month. You want to follow Google-recommended best practices.
How should you configure the end-to-end architecture of the predictive model?
- A . Configure Kubeflow Pipelines to schedule your multi-step workflow from training to deploying your model.
- B . Use a model trained and deployed on BigQuery ML and trigger retraining with the scheduled query feature in BigQuery
- C . Write a Cloud Functions script that launches a training and deploying job on Ai Platform that is triggered by Cloud Scheduler
- D . Use Cloud Composer to programmatically schedule a Dataflow job that executes the workflow from training to deploying your model
A
Explanation:
The end-to-end architecture of the predictive model for estimating delay times for multiple transportation routes should be configured using Kubeflow Pipelines. Kubeflow Pipelines is a platform for building and deploying scalable, portable, and reusable machine learning pipelines on Kubernetes. Kubeflow Pipelines allows you to orchestrate your multi-step workflow from data preparation, model training, model evaluation, model deployment, and model serving. Kubeflow Pipelines also provides a user interface for managing and tracking your pipeline runs, experiments, and artifacts1
Using Kubeflow Pipelines has several advantages for this use case:
Full automation: You can define your pipeline as a Python script that specifies the steps and dependencies of your workflow, and use the Kubeflow Pipelines SDK to compile and upload your pipeline to the Kubeflow Pipelines service. You can also use the Kubeflow Pipelines UI to create, run, and monitor your pipeline2
Scalability: You can leverage the power of Kubernetes to scale your pipeline components horizontally and vertically, and use distributed training frameworks such as TensorFlow or PyTorch to train your model on multiple nodes or GPUs3
Portability: You can package your pipeline components as Docker containers that can run on any Kubernetes cluster, and use the Kubeflow Pipelines SDK to export and import your pipeline packages across different environments4
Reusability: You can reuse your pipeline components across different pipelines, and share your components with other users through the Kubeflow Pipelines Component Store. You can also use pre-built components from the Kubeflow Pipelines library or other sources5
Schedulability: You can use the Kubeflow Pipelines UI or the Kubeflow Pipelines SDK to schedule recurring pipeline runs based on cron expressions or intervals. For example, you can schedule your pipeline to run every month to retrain your model on the latest data.
The other options are not as suitable for this use case. Using a model trained and deployed on BigQuery ML is not recommended, as BigQuery ML is mainly designed for simple and quick machine learning tasks on large-scale data, and does not support complex models or custom code. Writing a Cloud Functions script that launches a training and deploying job on AI Platform is not ideal, as Cloud Functions has limitations on the memory, CPU, and execution time, and does not provide a user interface for managing and tracking your pipeline. Using Cloud Composer to programmatically schedule a Dataflow job that executes the workflow from training to deploying your model is not optimal, as Dataflow is mainly designed for data processing and streaming analytics, and does not support model serving or monitoring.
Reference: 1: Kubeflow Pipelines overview 2: Build a pipeline 3: Scale your machine learning training
and prediction workloads 4: Export and import pipelines 5: Build components and pipelines:
[Schedule recurring pipeline runs]: [BigQuery ML overview]: [Cloud Functions documentation] :
[Dataflow documentation]
You are an ML engineer at a global shoe store. You manage the ML models for the company’s website. You are asked to build a model that will recommend new products to the user based on their purchase behavior and similarity with other users.
What should you do?
- A . Build a classification model
- B . Build a knowledge-based filtering model
- C . Build a collaborative-based filtering model
- D . Build a regression model using the features as predictors
C
Explanation:
A recommender system is a type of machine learning system that suggests relevant items to users based on their preferences and behavior. Recommender systems are widely used in e-commerce, media, and entertainment industries to enhance user experience and increase revenue1
There are different types of recommender systems that use different filtering methods to generate recommendations.
The most common types are:
Content-based filtering: This method uses the features of the items and the users to find the similarity between them. For example, a content-based recommender system for movies may use the genre, director, cast, and ratings of the movies, and the preferences, demographics, and history of the users, to recommend movies that are similar to the ones the user liked before2 Collaborative filtering: This method uses the feedback and ratings of the users to find the similarity between them and the items. For example, a collaborative filtering recommender system for books may use the ratings of the users for different books, and recommend books that are liked by other users who have similar ratings to the target user3
Hybrid method: This method combines content-based and collaborative filtering methods to overcome the limitations of each method and improve the accuracy and diversity of the recommendations. For example, a hybrid recommender system for music may use both the features of the songs and the artists, and the ratings and listening habits of the users, to recommend songs that match the user’s taste and preferences4
Deep learning-based: This method uses deep neural networks to learn complex and non-linear patterns from the data and generate recommendations. Deep learning-based recommender systems can handle large-scale and high-dimensional data, and incorporate various types of information, such as text, images, audio, and video. For example, a deep learning-based recommender system for fashion may use the images and descriptions of the products, and the profiles and feedback of the users, to recommend products that suit the user’s style and preferences.
For the use case of building a model that will recommend new products to the user based on their purchase behavior and similarity with other users, the best option is to build a collaborative-based filtering model. This is because collaborative filtering can leverage the implicit feedback and ratings of the users to find the items that are most likely to interest them. Collaborative filtering can also help discover new products that the user may not be aware of, and increase the diversity and serendipity of the recommendations3
The other options are not as suitable for this use case. Building a classification model or a regression model using the features as predictors is not a good idea, as these models are not designed for recommendation tasks, and may not capture the preferences and behavior of the users. Building a knowledge-based filtering model is not relevant, as this method uses the explicit knowledge and requirements of the users to find the items that meet their criteria, and does not rely on the purchase behavior or similarity with other users.
Reference: 1: Recommender system 2: Content-based filtering 3: Collaborative filtering 4: Hybrid recommender system: [Deep learning for recommender systems]: [Knowledge-based recommender system]
You are training an LSTM-based model on Al Platform to summarize text using the following job submission script:
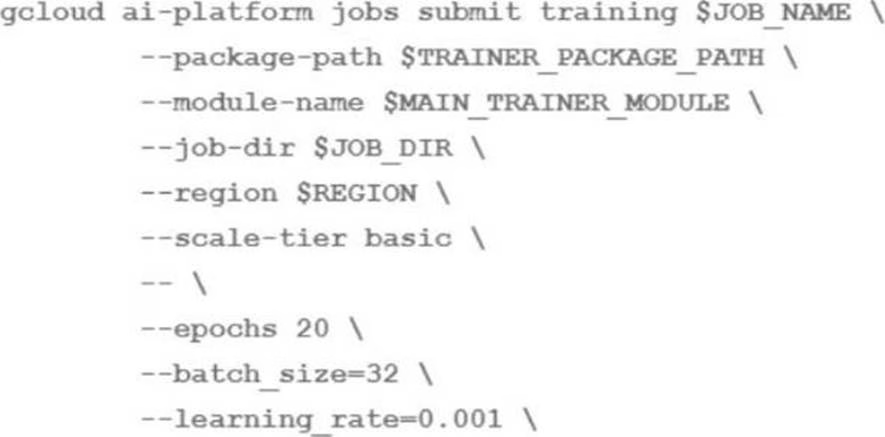

You want to ensure that training time is minimized without significantly compromising the accuracy of your model.
What should you do?
- A . Modify the ‘epochs’ parameter
- B . Modify the ‘scale-tier’ parameter
- C . Modify the batch size’ parameter
- D . Modify the ‘learning rate’ parameter
B
Explanation:
The training time of a machine learning model depends on several factors, such as the complexity of the model, the size of the data, the hardware resources, and the hyperparameters. To minimize the training time without significantly compromising the accuracy of the model, one should optimize these factors as much as possible.
One of the factors that can have a significant impact on the training time is the scale-tier parameter, which specifies the type and number of machines to use for the training job on AI Platform. The scale-tier parameter can be one of the predefined values, such as BASIC, STANDARD_1, PREMIUM_1, or BASIC_GPU, or a custom value that allows you to configure the machine type, the number of workers, and the number of parameter servers1
To speed up the training of an LSTM-based model on AI Platform, one should modify the scale-tier parameter to use a higher tier or a custom configuration that provides more computational resources, such as more CPUs, GPUs, or TPUs. This can reduce the training time by increasing the parallelism and throughput of the model training. However, one should also consider the trade-off between the training time and the cost, as higher tiers or custom configurations may incur higher charges2
The other options are not as effective or may have adverse effects on the model accuracy. Modifying the epochs parameter, which specifies the number of times the model sees the entire dataset, may reduce the training time, but also affect the model’s convergence and performance. Modifying the batch size parameter, which specifies the number of examples per batch, may affect the model’s stability and generalization ability, as well as the memory usage and the gradient update frequency. Modifying the learning rate parameter, which specifies the step size of the gradient descent optimization, may affect the model’s convergence and performance, as well as the risk of overshooting or getting stuck in local minima3
Reference: 1: Using predefined machine types 2: Distributed training 3: Hyperparameter tuning overview
You are training a TensorFlow model on a structured data set with 100 billion records stored in several CSV files. You need to improve the input/output execution performance.
What should you do?
- A . Load the data into BigQuery and read the data from BigQuery.
- B . Load the data into Cloud Bigtable, and read the data from Bigtable
- C . Convert the CSV files into shards of TFRecords, and store the data in Cloud Storage
- D . Convert the CSV files into shards of TFRecords, and store the data in the Hadoop Distributed File System (HDFS)
C
Explanation:
The input/output execution performance of a TensorFlow model depends on how efficiently the model can read and process the data from the data source. Reading and processing data from CSV files can be slow and inefficient, especially if the data is large and distributed. Therefore, to improve the input/output execution performance, one should use a more suitable data format and storage system.
One of the best options for improving the input/output execution performance is to convert the CSV files into shards of TFRecords, and store the data in Cloud Storage. TFRecord is a binary data format that can store a sequence of serialized TensorFlow examples.
TFRecord has several advantages over CSV, such as:
Faster data loading: TFRecord can be read and processed faster than CSV, as it avoids the overhead of parsing and decoding the text data. TFRecord also supports compression and checksums, which can reduce the data size and ensure data integrity1
Better performance: TFRecord can improve the performance of the model, as it allows the model to access the data in a sequential and streaming manner, and leverage the tf.data API to build efficient data pipelines. TFRecord also supports sharding and interleaving, which can increase the parallelism and throughput of the data processing2
Easier integration: TFRecord can integrate seamlessly with TensorFlow, as it is the native data format for TensorFlow. TFRecord also supports various types of data, such as images, text, audio, and video, and can store the data schema and metadata along with the data3
Cloud Storage is a scalable and reliable object storage service that can store any amount of data.
Cloud Storage has several advantages over other storage systems, such as:
High availability: Cloud Storage can provide high availability and durability for the data, as it replicates the data across multiple regions and zones, and supports versioning and lifecycle management. Cloud Storage also offers various storage classes, such as Standard, Nearline, Coldline, and Archive, to meet different performance and cost requirements4
Low latency: Cloud Storage can provide low latency and high bandwidth for the data, as it supports HTTP and HTTPS protocols, and integrates with other Google Cloud services, such as AI Platform, Dataflow, and BigQuery. Cloud Storage also supports resumable uploads and downloads, and parallel composite uploads, which can improve the data transfer speed and reliability5
Easy access: Cloud Storage can provide easy access and management for the data, as it supports various tools and libraries, such as gsutil, Cloud Console, and Cloud Storage Client Libraries. Cloud Storage also supports fine-grained access control and encryption, which can ensure the data security and privacy.
The other options are not as effective or feasible. Loading the data into BigQuery and reading the data from BigQuery is not recommended, as BigQuery is mainly designed for analytical queries on large-scale data, and does not support streaming or real-time data processing. Loading the data into Cloud Bigtable and reading the data from Bigtable is not ideal, as Cloud Bigtable is mainly designed for low-latency and high-throughput key-value operations on sparse and wide tables, and does not support complex data types or schemas. Converting the CSV files into shards of TFRecords and storing the data in the Hadoop Distributed File System (HDFS) is not optimal, as HDFS is not natively supported by TensorFlow, and requires additional configuration and dependencies, such as Hadoop, Spark, or Beam.
Reference: 1: TFRecord and tf.Example 2: Better performance with the tf.data API 3: TensorFlow Data
Validation 4: Cloud Storage overview 5: Performance: [How-to guides]
You have deployed multiple versions of an image classification model on Al Platform. You want to monitor the performance of the model versions overtime.
How should you perform this comparison?
- A . Compare the loss performance for each model on a held-out dataset.
- B . Compare the loss performance for each model on the validation data
- C . Compare the receiver operating characteristic (ROC) curve for each model using the What-lf Tool
- D . Compare the mean average precision across the models using the Continuous Evaluation feature
D
Explanation:
The performance of an image classification model can be measured by various metrics, such as accuracy, precision, recall, F1-score, and mean average precision (mAP). These metrics can be calculated based on the confusion matrix, which compares the predicted labels and the true labels of the images1
One of the best ways to monitor the performance of multiple versions of an image classification model on AI Platform is to compare the mean average precision across the models using the Continuous Evaluation feature. Mean average precision is a metric that summarizes the precision and recall of a model across different confidence thresholds and classes. Mean average precision is especially useful for multi-class and multi-label image classification problems, where the model has to assign one or more labels to each image from a set of possible labels. Mean average precision can range from 0 to 1, where a higher value indicates a better performance2
Continuous Evaluation is a feature of AI Platform that allows you to automatically evaluate the performance of your deployed models using online prediction requests and responses. Continuous Evaluation can help you monitor the quality and consistency of your models over time, and detect any issues or anomalies that may affect the model performance. Continuous Evaluation can also provide various evaluation metrics and visualizations, such as accuracy, precision, recall, F1-score, ROC curve, and confusion matrix, for different types of models, such as classification, regression, and object detection3
To compare the mean average precision across the models using the Continuous Evaluation feature, you need to do the following steps:
Enable the online prediction logging for each model version that you want to evaluate. This will allow AI Platform to collect the prediction requests and responses from your models and store them in BigQuery4
Create an evaluation job for each model version that you want to evaluate. This will allow AI Platform to compare the predicted labels and the true labels of the images, and calculate the evaluation metrics, such as mean average precision. You need to specify the BigQuery table that contains the prediction logs, the data schema, the label column, and the evaluation interval.
View the evaluation results for each model version on the AI Platform Models page in the Google Cloud console. You can see the mean average precision and other metrics for each model version over time, and compare them using charts and tables. You can also filter the results by different classes and confidence thresholds.
The other options are not as effective or feasible. Comparing the loss performance for each model on a held-out dataset or on the validation data is not a good idea, as the loss function may not reflect the actual performance of the model on the online prediction data, and may vary depending on the choice of the loss function and the optimization algorithm. Comparing the receiver operating characteristic (ROC) curve for each model using the What-If Tool is not possible, as the What-If Tool does not support image data or multi-class classification problems.
Reference: 1: Confusion matrix 2: Mean average precision 3: Continuous Evaluation overview 4: Configure online prediction logging: [Create an evaluation job]: [View evaluation results]: [What-If Tool overview]
Your team trained and tested a DNN regression model with good results. Six months after deployment, the model is performing poorly due to a change in the distribution of the input data.
How should you address the input differences in production?
- A . Create alerts to monitor for skew, and retrain the model.
- B . Perform feature selection on the model, and retrain the model with fewer features
- C . Retrain the model, and select an L2 regularization parameter with a hyperparameter tuning service
- D . Perform feature selection on the model, and retrain the model on a monthly basis with fewer features
A
Explanation:
The performance of a DNN regression model can degrade over time due to a change in the distribution of the input data. This phenomenon is known as data drift or concept drift, and it can affect the accuracy and reliability of the model predictions. Data drift can be caused by various factors, such as seasonal changes, population shifts, market trends, or external events1
To address the input differences in production, one should create alerts to monitor for skew, and retrain the model. Skew is a measure of how much the input data in production differs from the input data used for training the model. Skew can be detected by comparing the statistics and distributions of the input features in the training and production data, such as mean, standard deviation, histogram, or quantiles. Alerts can be set up to notify the model developers or operators when the skew exceeds a certain threshold, indicating a significant change in the input data2
When an alert is triggered, the model should be retrained with the latest data that reflects the current distribution of the input features. Retraining the model can help the model adapt to the new data and improve its performance. Retraining the model can be done manually or automatically, depending on the frequency and severity of the data drift. Retraining the model can also involve updating the model architecture, hyperparameters, or optimization algorithm, if necessary3
The other options are not as effective or feasible. Performing feature selection on the model and retraining the model with fewer features is not a good idea, as it may reduce the expressiveness and complexity of the model, and ignore some important features that may affect the output. Retraining the model and selecting an L2 regularization parameter with a hyperparameter tuning service is not relevant, as L2 regularization is a technique to prevent overfitting, not data drift. Retraining the model on a monthly basis with fewer features is not optimal, as it may not capture the timely changes in the input data, and may compromise the model performance.
Reference: 1: Data drift detection for machine learning models 2: Skew and drift
detection 3: Retraining machine learning models
You manage a team of data scientists who use a cloud-based backend system to submit training jobs.
This system has become very difficult to administer, and you want to use a managed service instead.
The data scientists you work with use many different frameworks, including Keras, PyTorch, theano.
Scikit-team, and custom libraries.
What should you do?
- A . Use the Al Platform custom containers feature to receive training jobs using any framework
- B . Configure Kubeflow to run on Google Kubernetes Engine and receive training jobs through TFJob
- C . Create a library of VM images on Compute Engine; and publish these images on a centralized repository
- D . Set up Slurm workload manager to receive jobs that can be scheduled to run on your cloud infrastructure.
A
Explanation:
A cloud-based backend system is a system that runs on a cloud platform and provides services or resources to other applications or users. A cloud-based backend system can be used to submit training jobs, which are tasks that involve training a machine learning model on a given dataset using a specific framework and configuration1
However, a cloud-based backend system can also have some drawbacks, such as:
High maintenance: A cloud-based backend system may require a lot of administration and management, such as provisioning, scaling, monitoring, and troubleshooting the cloud resources and services. This can be time-consuming and costly, and may distract from the core business objectives2 Low flexibility: A cloud-based backend system may not support all the frameworks and libraries that the data scientists need to use for their training jobs. This can limit the choices and capabilities of the data scientists, and affect the quality and performance of their models3
Poor integration: A cloud-based backend system may not integrate well with other cloud services or tools that the data scientists need to use for their machine learning workflows, such as data processing, model deployment, or model monitoring. This can create compatibility and interoperability issues, and reduce the efficiency and productivity of the data scientists.
Therefore, it may be better to use a managed service instead of a cloud-based backend system to submit training jobs. A managed service is a service that is provided and operated by a third-party provider, and offers various benefits, such as:
Low maintenance: A managed service handles the administration and management of the cloud resources and services, and abstracts away the complexity and details of the underlying infrastructure. This can save time and money, and allow the data scientists to focus on their core tasks2
High flexibility: A managed service can support multiple frameworks and libraries that the data scientists need to use for their training jobs, and allow them to customize and configure their training environments and parameters. This can enhance the choices and capabilities of the data scientists, and improve the quality and performance of their models3
Easy integration: A managed service can integrate seamlessly with other cloud services or tools that the data scientists need to use for their machine learning workflows, and provide a unified and consistent interface and experience. This can solve the compatibility and interoperability issues, and increase the efficiency and productivity of the data scientists.
One of the best options for using a managed service to submit training jobs is to use the AI Platform custom containers feature to receive training jobs using any framework. AI Platform is a Google Cloud service that provides a platform for building, deploying, and managing machine learning models. AI Platform supports various machine learning frameworks, such as TensorFlow, PyTorch, scikit-learn, and XGBoost, and provides various features, such as hyperparameter tuning, distributed training, online prediction, and model monitoring.
The AI Platform custom containers feature allows the data scientists to use any framework or library that they want for their training jobs, and package their training application and dependencies as a Docker container image. The data scientists can then submit their training jobs to AI Platform, and specify the container image and the training parameters. AI Platform will run the training jobs on the cloud infrastructure, and handle the scaling, logging, and monitoring of the training jobs. The data scientists can also use the AI Platform features to optimize, deploy, and manage their models.
The other options are not as suitable or feasible. Configuring Kubeflow to run on Google Kubernetes Engine and receive training jobs through TFJob is not ideal, as Kubeflow is mainly designed for TensorFlow-based training jobs, and does not support other frameworks or libraries. Creating a library of VM images on Compute Engine and publishing these images on a centralized repository is not optimal, as Compute Engine is a low-level service that requires a lot of administration and management, and does not provide the features and integrations of AI Platform. Setting up Slurm workload manager to receive jobs that can be scheduled to run on your cloud infrastructure is not relevant, as Slurm is a tool for managing and scheduling jobs on a cluster of nodes, and does not provide a managed service for training jobs.
Reference: 1: Cloud computing 2: Managed services 3: Machine learning frameworks: [Machine learning workflow]: [AI Platform overview]: [Custom containers for training]
You are developing a Kubeflow pipeline on Google Kubernetes Engine. The first step in the pipeline is to issue a query against BigQuery. You plan to use the results of that query as the input to the next step in your pipeline. You want to achieve this in the easiest way possible.
What should you do?
- A . Use the BigQuery console to execute your query and then save the query results Into a new BigQuery table.
- B . Write a Python script that uses the BigQuery API to execute queries against BigQuery Execute this script as the first step in your Kubeflow pipeline
- C . Use the Kubeflow Pipelines domain-specific language to create a custom component that uses the Python BigQuery client library to execute queries
- D . Locate the Kubeflow Pipelines repository on GitHub Find the BigQuery Query Component, copy that component’s URL, and use it to load the component into your pipeline. Use the component to execute queries against BigQuery
D
Explanation:
Kubeflow is an open source platform for developing, orchestrating, deploying, and running scalable and portable machine learning workflows on Kubernetes. Kubeflow Pipelines is a component of Kubeflow that allows you to build and manage end-to-end machine learning pipelines using a graphical user interface or a Python-based domain-specific language (DSL). Kubeflow Pipelines can help you automate and orchestrate your machine learning workflows, and integrate with various Google Cloud services and tools1
One of the Google Cloud services that you can use with Kubeflow Pipelines is BigQuery, which is a serverless, scalable, and cost-effective data warehouse that allows you to run fast and complex queries on large-scale data. BigQuery can help you analyze and prepare your data for machine learning, and store and manage your machine learning models2
To execute a query against BigQuery as the first step in your Kubeflow pipeline, and use the results of that query as the input to the next step in your pipeline, the easiest way to do that is to use the BigQuery Query Component, which is a pre-built component that you can find in the Kubeflow Pipelines repository on GitHub. The BigQuery Query Component allows you to run a SQL query on BigQuery, and output the results as a table or a file. You can use the component’s URL to load the component into your pipeline, and specify the query and the output parameters. You can then use the output of the component as the input to the next step in your pipeline, such as a data processing or a model training step3
The other options are not as easy or feasible. Using the BigQuery console to execute your query and then save the query results into a new BigQuery table is not a good idea, as it does not integrate with your Kubeflow pipeline, and requires manual intervention and duplication of data. Writing a Python script that uses the BigQuery API to execute queries against BigQuery is not ideal, as it requires writing custom code and handling authentication and error handling. Using the Kubeflow Pipelines DSL to create a custom component that uses the Python BigQuery client library to execute queries is not optimal, as it requires creating and packaging a Docker container image for the component, and testing and debugging the component.
Reference: 1: Kubeflow Pipelines overview 2: BigQuery overview 3: BigQuery Query Component
You are developing ML models with Al Platform for image segmentation on CT scans. You frequently update your model architectures based on the newest available research papers, and have to rerun training on the same dataset to benchmark their performance. You want to minimize computation costs and manual intervention while having version control for your code.
What should you do?
- A . Use Cloud Functions to identify changes to your code in Cloud Storage and trigger a retraining job
- B . Use the gcloud command-line tool to submit training jobs on Al Platform when you update your code
- C . Use Cloud Build linked with Cloud Source Repositories to trigger retraining when new code is pushed to the repository
- D . Create an automated workflow in Cloud Composer that runs daily and looks for changes in code in Cloud Storage using a sensor.
C
Explanation:
Developing ML models with AI Platform for image segmentation on CT scans requires a lot of computation and experimentation, as image segmentation is a complex and challenging task that involves assigning a label to each pixel in an image. Image segmentation can be used for various medical applications, such as tumor detection, organ segmentation, or lesion localization1
To minimize the computation costs and manual intervention while having version control for the code, one should use Cloud Build linked with Cloud Source Repositories to trigger retraining when new code is pushed to the repository. Cloud Build is a service that executes your builds on Google Cloud Platform infrastructure. Cloud Build can import source code from Cloud Source Repositories, Cloud Storage, GitHub, or Bitbucket, execute a build to your specifications, and produce artifacts such as Docker containers or Java archives2
Cloud Build allows you to set up automated triggers that start a build when changes are pushed to a source code repository. You can configure triggers to filter the changes based on the branch, tag, or file path3
Cloud Source Repositories is a service that provides fully managed private Git repositories on Google Cloud Platform. Cloud Source Repositories allows you to store, manage, and track your code using the Git version control system. You can also use Cloud Source Repositories to connect to other Google Cloud services, such as Cloud Build, Cloud Functions, or Cloud Run4
To use Cloud Build linked with Cloud Source Repositories to trigger retraining when new code is pushed to the repository, you need to do the following steps:
Create a Cloud Source Repository for your code, and push your code to the repository. You can use the Cloud SDK, Cloud Console, or Cloud Source Repositories API to create and manage your repository5
Create a Cloud Build trigger for your repository, and specify the build configuration and the trigger settings. You can use the Cloud SDK, Cloud Console, or Cloud Build API to create and manage your trigger.
Specify the steps of the build in a YAML or JSON file, such as installing the dependencies, running the tests, building the container image, and submitting the training job to AI Platform. You can also use the Cloud Build predefined or custom build steps to simplify your build configuration.
Push your new code to the repository, and the trigger will start the build automatically. You can monitor the status and logs of the build using the Cloud SDK, Cloud Console, or Cloud Build API. The other options are not as easy or feasible. Using Cloud Functions to identify changes to your code in Cloud Storage and trigger a retraining job is not ideal, as Cloud Functions has limitations on the memory, CPU, and execution time, and does not provide a user interface for managing and tracking your builds. Using the gcloud command-line tool to submit training jobs on AI Platform when you update your code is not optimal, as it requires manual intervention and does not leverage the benefits of Cloud Build and its integration with Cloud Source Repositories. Creating an automated workflow in Cloud Composer that runs daily and looks for changes in code in Cloud Storage using a sensor is not relevant, as Cloud Composer is mainly designed for orchestrating complex workflows across multiple systems, and does not provide a version control system for your code.
Reference: 1: Image segmentation 2: Cloud Build overview 3: Creating and managing build
triggers 4: Cloud Source Repositories overview 5: Quickstart: Create a repository: [Quickstart: Create
a build trigger]: [Configuring builds]: [Viewing build results]
Your organization’s call center has asked you to develop a model that analyzes customer sentiments in each call. The call center receives over one million calls daily, and data is stored in Cloud Storage. The data collected must not leave the region in which the call originated, and no Personally Identifiable Information (Pll) can be stored or analyzed. The data science team has a third-party tool for visualization and access which requires a SQL ANSI-2011 compliant interface. You need to select components for data processing and for analytics.
How should the data pipeline be designed?
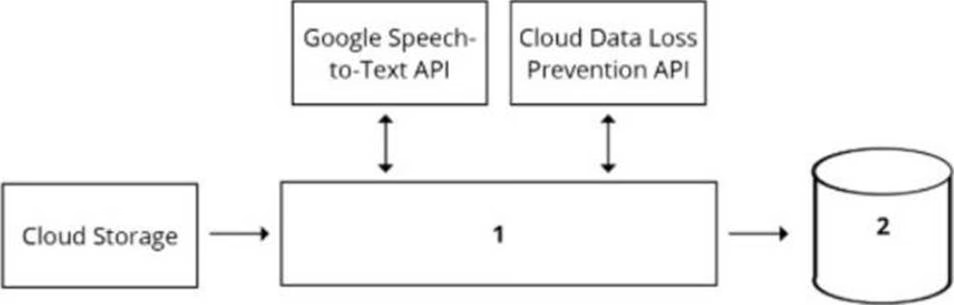

- A . 1 Dataflow, 2 BigQuery
- B . 1 Pub/Sub, 2 Datastore
- C . 1 Dataflow, 2 Cloud SQL
- D . 1 Cloud Function, 2 Cloud SQL
A
Explanation:
A data pipeline is a set of steps or processes that move data from one or more sources to one or more destinations, usually for the purpose of analysis, transformation, or storage. A data pipeline can be designed using various components, such as data sources, data processing tools, data storage systems, and data analytics tools1
To design a data pipeline for analyzing customer sentiments in each call, one should consider the following requirements and constraints:
The call center receives over one million calls daily, and data is stored in Cloud Storage. This implies that the data is large, unstructured, and distributed, and requires a scalable and efficient data processing tool that can handle various types of data formats, such as audio, text, or image.
The data collected must not leave the region in which the call originated, and no Personally Identifiable Information (Pll) can be stored or analyzed. This implies that the data is sensitive and subject to data privacy and compliance regulations, and requires a secure and reliable data storage system that can enforce data encryption, access control, and regional policies.
The data science team has a third-party tool for visualization and access which requires a SQL ANSI-2011 compliant interface. This implies that the data analytics tool is external and independent of the data pipeline, and requires a standard and compatible data interface that can support SQL queries and operations.
One of the best options for selecting components for data processing and for analytics is to use Dataflow for data processing and BigQuery for analytics. Dataflow is a fully managed service for executing Apache Beam pipelines for data processing, such as batch or stream processing, extract-transform-load (ETL), or data integration. BigQuery is a serverless, scalable, and cost-effective data warehouse that allows you to run fast and complex queries on large-scale data23
Using Dataflow and BigQuery has several advantages for this use case:
Dataflow can process large and unstructured data from Cloud Storage in a parallel and distributed manner, and apply various transformations, such as converting audio to text, extracting sentiment scores, or anonymizing PII. Dataflow can also handle both batch and stream processing, which can enable real-time or near-real-time analysis of the call data.
BigQuery can store and analyze the processed data from Dataflow in a secure and reliable way, and enforce data encryption, access control, and regional policies. BigQuery can also support SQL ANSI-2011 compliant interface, which can enable the data science team to use their third-party tool for visualization and access. BigQuery can also integrate with various Google Cloud services and tools, such as AI Platform, Data Studio, or Looker.
Dataflow and BigQuery can work seamlessly together, as they are both part of the Google Cloud ecosystem, and support various data formats, such as CSV, JSON, Avro, or Parquet. Dataflow and BigQuery can also leverage the benefits of Google Cloud infrastructure, such as scalability, performance, and cost-effectiveness.
The other options are not as suitable or feasible. Using Pub/Sub for data processing and Datastore for analytics is not ideal, as Pub/Sub is mainly designed for event-driven and asynchronous messaging, not data processing, and Datastore is mainly designed for low-latency and high-throughput key-value operations, not analytics. Using Cloud Function for data processing and Cloud SQL for analytics is not optimal, as Cloud Function has limitations on the memory, CPU, and execution time, and does not support complex data processing, and Cloud SQL is a relational database service that may not scale well for large-scale data. Using Cloud Composer for data processing and Cloud SQL for analytics is not relevant, as Cloud Composer is mainly designed for orchestrating complex workflows across multiple systems, not data processing, and Cloud SQL is a relational database service that may not scale well for large-scale data.
Reference: 1: Data pipeline 2: Dataflow overview 3: BigQuery overview: [Dataflow documentation]: [BigQuery documentation]
You work for an online retail company that is creating a visual search engine. You have set up an end-to-end ML pipeline on Google Cloud to classify whether an image contains your company’s product. Expecting the release of new products in the near future, you configured a retraining functionality in the pipeline so that new data can be fed into your ML models. You also want to use Al Platform’s continuous evaluation service to ensure that the models have high accuracy on your test data set.
What should you do?
- A . Keep the original test dataset unchanged even if newer products are incorporated into retraining
- B . Extend your test dataset with images of the newer products when they are introduced to retraining
- C . Replace your test dataset with images of the newer products when they are introduced to retraining.
- D . Update your test dataset with images of the newer products when your evaluation metrics drop below a pre-decided threshold.
B
Explanation:
The test dataset is used to evaluate the performance of the ML model on unseen data. It should reflect the distribution of the data that the model will encounter in production. Therefore, if the retraining data includes new products, the test dataset should also be extended with images of those products to ensure that the model can generalize well to them. Keeping the original test dataset unchanged or replacing it entirely with images of the new products would not capture the diversity of the data that the model needs to handle. Updating the test dataset only when the evaluation metrics drop below a threshold would be reactive rather than proactive, and might result in poor user experience if the model fails to recognize the new products.
Reference: Continuous evaluation documentation
Preparing and using test sets
You are responsible for building a unified analytics environment across a variety of on-premises data marts. Your company is experiencing data quality and security challenges when integrating data across the servers, caused by the use of a wide range of disconnected tools and temporary solutions. You need a fully managed, cloud-native data integration service that will lower the total cost of work and reduce repetitive work. Some members on your team prefer a codeless interface for building Extract, Transform, Load (ETL) process.
Which service should you use?
- A . Dataflow
- B . Dataprep
- C . Apache Flink
- D . Cloud Data Fusion
D
Explanation:
Cloud Data Fusion is a fully managed, cloud-native data integration service that helps users efficiently build and manage ETL/ELT data pipelines. It provides a graphical interface to increase time efficiency and reduce complexity, and allows users to easily create and explore data pipelines using a code-free, point and click visual interface. Cloud Data Fusion also supports a broad range of data sources and formats, including on-premises data marts, and ensures data quality and security by using built-in transformation capabilities and Cloud Data Loss Prevention. Cloud Data Fusion lowers the total cost of ownership by handling performance, scalability, availability, security, and compliance needs automatically.
Reference: Cloud Data Fusion documentation
Cloud Data Fusion overview
You want to rebuild your ML pipeline for structured data on Google Cloud. You are using PySpark to conduct data transformations at scale, but your pipelines are taking over 12 hours to run. To speed up development and pipeline run time, you want to use a serverless tool and SQL syntax. You have already moved your raw data into Cloud Storage.
How should you build the pipeline on Google Cloud while meeting the speed and processing requirements?
- A . Use Data Fusion’s GUI to build the transformation pipelines, and then write the data into BigQuery
- B . Convert your PySpark into SparkSQL queries to transform the data and then run your pipeline on Dataproc to write the data into BigQuery.
- C . Ingest your data into Cloud SQL convert your PySpark commands into SQL queries to transform the data, and then use federated queries from BigQuery for machine learning
- D . Ingest your data into BigQuery using BigQuery Load, convert your PySpark commands into BigQuery SQL queries to transform the data, and then write the transformations to a new table
D
Explanation:
BigQuery is a serverless, scalable, and cost-effective data warehouse that allows users to run SQL queries on large volumes of data. BigQuery Load is a tool that can ingest data from Cloud Storage into BigQuery tables. BigQuery SQL is a dialect of SQL that supports many of the same functions and operations as PySpark, such as window functions, aggregate functions, joins, and subqueries. By using BigQuery Load and BigQuery SQL, you can rebuild your ML pipeline for structured data on Google Cloud without having to manage any servers or clusters, and with faster performance and lower cost than using PySpark on Dataproc. You can also use BigQuery ML to create and evaluate ML models using SQL commands.
Reference: BigQuery documentation
BigQuery Load documentation
BigQuery SQL reference
BigQuery ML documentation
You are building a real-time prediction engine that streams files which may contain Personally Identifiable Information (Pll) to Google Cloud. You want to use the Cloud Data Loss Prevention (DLP) API to scan the files.
How should you ensure that the Pll is not accessible by unauthorized individuals?
- A . Stream all files to Google CloudT and then write the data to BigQuery Periodically conduct a bulk scan of the table using the DLP API.
- B . Stream all files to Google Cloud, and write batches of the data to BigQuery While the data is being written to BigQuery conduct a bulk scan of the data using the DLP API.
- C . Create two buckets of data Sensitive and Non-sensitive Write all data to the Non-sensitive bucket Periodically conduct a bulk scan of that bucket using the DLP API, and move the sensitive data to the Sensitive bucket
- D . Create three buckets of data: Quarantine, Sensitive, and Non-sensitive Write all data to the Quarantine bucket.
- E . Periodically conduct a bulk scan of that bucket using the DLP API, and move the data to either the Sensitive or Non-Sensitive bucket
D
Explanation:
The Cloud DLP API is a service that allows users to inspect, classify, and de-identify sensitive data. It can be used to scan data in Cloud Storage, BigQuery, Cloud Datastore, and Cloud Pub/Sub. The best way to ensure that the PII is not accessible by unauthorized individuals is to use a quarantine bucket to store the data before scanning it with the DLP API. This way, the data is isolated from other applications and users until it is classified and moved to the appropriate bucket. The other options are not as secure or efficient, as they either expose the data to BigQuery before scanning, or scan the data after writing it to a non-sensitive bucket.
Reference: Cloud DLP documentation
Scanning and classifying Cloud Storage files
You are designing an ML recommendation model for shoppers on your company’s ecommerce website. You will use Recommendations Al to build, test, and deploy your system.
How should you develop recommendations that increase revenue while following best practices?
- A . Use the "Other Products You May Like" recommendation type to increase the click-through rate
- B . Use the "Frequently Bought Together’ recommendation type to increase the shopping cart size for each order.
- C . Import your user events and then your product catalog to make sure you have the highest quality event stream
- D . Because it will take time to collect and record product data, use placeholder values for the product catalog to test the viability of the model.
B
Explanation:
Recommendations AI is a service that allows users to build, test, and deploy personalized product recommendations for their ecommerce websites. It uses Google’s deep learning models to learn from user behavior and product data, and generate high-quality recommendations that can increase revenue, click-through rate, and customer satisfaction. One of the best practices for using Recommendations AI is to choose the right recommendation type for the business objective. The “Frequently Bought Together” recommendation type shows products that are often purchased together with the current product, and encourages users to add more items to their shopping cart. This can increase the average order value and the revenue for each transaction. The other options are not as effective or feasible for this objective. The “Other Products You May Like” recommendation type shows products that are similar to the current product, and may increase the click-through rate, but not necessarily the shopping cart size. Importing the user events and then the product catalog is not a recommended order, as it may cause data inconsistency and missing recommendations. The product catalog should be imported first, and then the user events. Using placeholder values for the product catalog is not a viable option, as it will not produce meaningful recommendations or reflect the real performance of the model.
Reference: Recommendations AI documentation
Choosing a recommendation type
Importing data to Recommendations AI
You are designing an architecture with a serverless ML system to enrich customer support tickets with informative metadata before they are routed to a support agent. You need a set of models to predict ticket priority, predict ticket resolution time, and perform sentiment analysis to help agents make strategic decisions when they process support requests. Tickets are not expected to have any domain-specific terms or jargon.
The proposed architecture has the following flow:
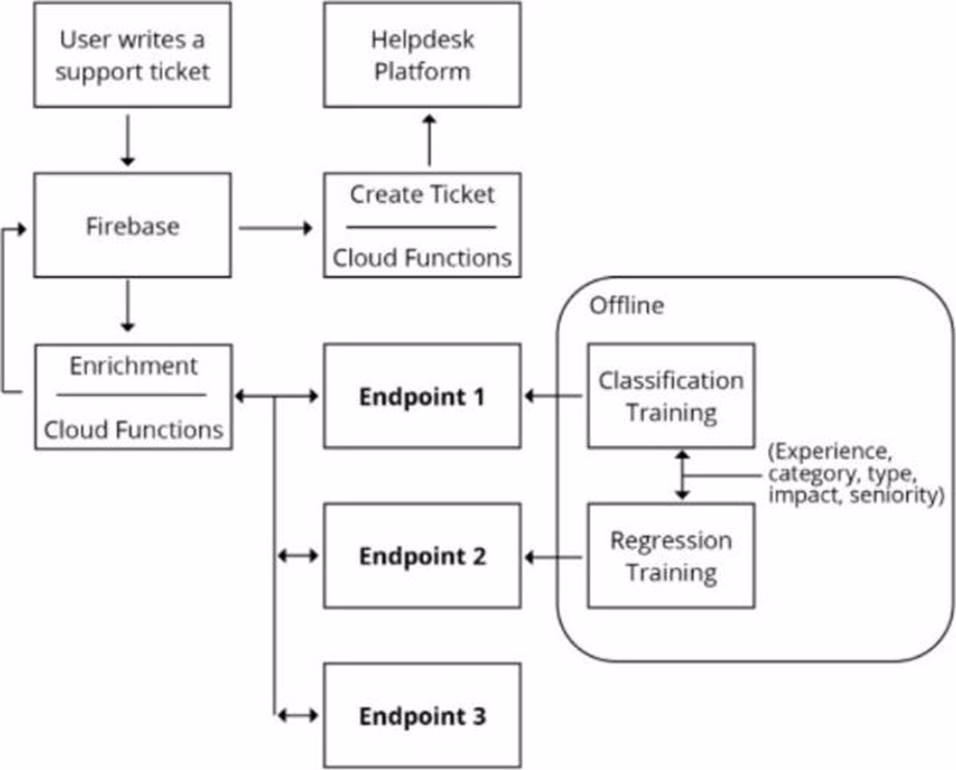

Which endpoints should the Enrichment Cloud Functions call?
- A . 1 Vertex Al. 2 Vertex Al. 3 AutoML Natural Language
- B . 1 Vertex Al. 2 Vertex Al. 3 Cloud Natural Language API
- C . 1 Vertex Al. 2 Vertex Al. 3 AutoML Vision
- D . 1 Cloud Natural Language API. 2 Vertex Al, 3 Cloud Vision API
B
Explanation:
Vertex AI is a unified platform for building and deploying ML models on Google Cloud. It supports both custom and AutoML models, and provides various tools and services for ML development, such as Vertex Pipelines, Vertex Vizier, Vertex Explainable AI, and Vertex Feature Store. Vertex AI can be used to create models for predicting ticket priority and resolution time, as these are domain-specific tasks that require custom training data and evaluation metrics. Cloud Natural Language API is a pre-trained service that provides natural language understanding capabilities, such as sentiment analysis, entity analysis, syntax analysis, and content classification. Cloud Natural Language API can be used to perform sentiment analysis on the support tickets, as this is a general task that does not require domain-specific knowledge or jargon. The other options are not suitable for the given architecture. AutoML Natural Language and AutoML Vision are services that allow users to create custom natural language and vision models using their own data and labels. They are not needed for sentiment analysis, as Cloud Natural Language API already provides this functionality. Cloud Vision API is a pre-trained service that provides image analysis capabilities, such as object detection, face detection, text detection, and image labeling. It is not relevant for the support tickets, as they are not expected to have any images.
Reference: Vertex AI documentation
Cloud Natural Language API documentation
You work with a data engineering team that has developed a pipeline to clean your dataset and save it in a Cloud Storage bucket. You have created an ML model and want to use the data to refresh your model as soon as new data is available. As part of your CI/CD workflow, you want to automatically run a Kubeflow Pipelines training job on Google Kubernetes Engine (GKE).
How should you architect this workflow?
- A . Configure your pipeline with Dataflow, which saves the files in Cloud Storage After the file is saved, start the training job on a GKE cluster
- B . Use App Engine to create a lightweight python client that continuously polls Cloud Storage for new files As soon as a file arrives, initiate the training job
- C . Configure a Cloud Storage trigger to send a message to a Pub/Sub topic when a new file is available in a storage bucket. Use a Pub/Sub-triggered Cloud Function to start the training job on a GKE cluster
- D . Use Cloud Scheduler to schedule jobs at a regular interval. For the first step of the job. check the timestamp of objects in your Cloud Storage bucket If there are no new files since the last run, abort the job.
C
Explanation:
This option is the best way to architect the workflow, as it allows you to use event-driven and serverless components to automate the ML training process. Cloud Storage triggers are a feature that allows you to send notifications to a Pub/Sub topic when an object is created, deleted, or updated in a storage bucket. Pub/Sub is a service that allows you to publish and subscribe to messages on various topics. Pub/Sub-triggered Cloud Functions are a type of Cloud Functions that are invoked when a message is published to a specific Pub/Sub topic. Cloud Functions are a serverless platform that allows you to run code in response to events. By using these components, you can create a workflow that starts the training job on a GKE cluster as soon as a new file is available in the Cloud Storage bucket, without having to manage any servers or poll for changes. The other options are not as efficient or scalable as this option. Dataflow is a service that allows you to
create and run data processing pipelines, but it is not designed to trigger ML training jobs on GKE.
App Engine is a service that allows you to build and deploy web applications, but it is not suitable for polling Cloud Storage for new files, as it may incur unnecessary costs and latency. Cloud Scheduler is a service that allows you to schedule jobs at regular intervals, but it is not ideal for triggering ML training jobs based on data availability, as it may miss some files or run unnecessary jobs.
Reference: Cloud Storage triggers documentation
Pub/Sub documentation
Pub/Sub-triggered Cloud Functions documentation
Cloud Functions documentation
Kubeflow Pipelines documentation
You are developing models to classify customer support emails. You created models with TensorFlow Estimators using small datasets on your on-premises system, but you now need to train the models using large datasets to ensure high performance. You will port your models to Google Cloud and want to minimize code refactoring and infrastructure overhead for easier migration from on-prem to cloud.
What should you do?
- A . Use Vertex Al Platform for distributed training
- B . Create a cluster on Dataproc for training
- C . Create a Managed Instance Group with autoscaling
- D . Use Kubeflow Pipelines to train on a Google Kubernetes Engine cluster.
A
Explanation:
Vertex AI Platform is a unified platform for building and deploying ML models on Google Cloud. It supports both custom and AutoML models, and provides various tools and services for ML development, such as Vertex Pipelines, Vertex Vizier, Vertex Explainable AI, and Vertex Feature Store. Vertex AI Platform allows users to train their TensorFlow models using distributed training, which can speed up the training process and handle large datasets. Vertex AI Platform also minimizes code refactoring and infrastructure overhead, as it is compatible with TensorFlow Estimators and handles the provisioning, configuration, and scaling of the training resources automatically. The other options are not as suitable for this scenario. Dataproc is a service that allows users to create and run data processing pipelines using Apache Spark and Hadoop, but it is not designed for TensorFlow model training. Managed Instance Groups are a feature that allows users to create and manage groups of identical compute instances, but they require more configuration and management than Vertex AI Platform. Kubeflow Pipelines are a tool that allows users to create and run ML workflows on Google Kubernetes Engine, but they involve more complexity and code changes than Vertex AI Platform.
Reference: Vertex AI Platform documentation
Distributed training with Vertex AI Platform
You work for a large technology company that wants to modernize their contact center. You have been asked to develop a solution to classify incoming calls by product so that requests can be more quickly routed to the correct support team. You have already transcribed the calls using the Speech-to-Text API. You want to minimize data preprocessing and development time.
How should you build the model?
- A . Use the Al Platform Training built-in algorithms to create a custom model
- B . Use AutoML Natural Language to extract custom entities for classification
- C . Use the Cloud Natural Language API to extract custom entities for classification
- D . Build a custom model to identify the product keywords from the transcribed calls, and then run the keywords through a classification algorithm
B
Explanation:
AutoML Natural Language is a service that allows users to create custom natural language models using their own data and labels. It supports various natural language tasks, such as text classification, entity extraction, and sentiment analysis. AutoML Natural Language can be used to build a model to classify incoming calls by product, as it can extract custom entities from the transcribed calls and assign them to predefined categories. AutoML Natural Language also minimizes data preprocessing and development time, as it handles the data preparation, model training, and evaluation automatically. The other options are not as suitable for this scenario. AI Platform Training built-in algorithms are a set of pre-defined algorithms that can be used to train ML models on AI Platform, but they do not support natural language processing tasks. Cloud Natural Language API is a pre-trained service that provides natural language understanding capabilities, such as sentiment analysis, entity analysis, syntax analysis, and content classification. However, it does not support custom entities or categories, and may not recognize the product names from the calls. Building a custom model to identify the product keywords and then running them through a classification algorithm would require more data preprocessing and development time, as well as more coding and testing.
Reference: AutoML Natural Language documentation
AI Platform Training built-in algorithms documentation
Cloud Natural Language API documentation
You are an ML engineer at a regulated insurance company. You are asked to develop an insurance approval model that accepts or rejects insurance applications from potential customers.
What factors should you consider before building the model?
- A . Redaction, reproducibility, and explainability
- B . Traceability, reproducibility, and explainability
- C . Federated learning, reproducibility, and explainability
- D . Differential privacy federated learning, and explainability
B
Explanation:
Before building an insurance approval model, an ML engineer should consider the factors of traceability, reproducibility, and explainability, as these are important aspects of responsible AI and fairness in a regulated domain. Traceability is the ability to track the provenance and lineage of the data, models, and decisions throughout the ML lifecycle. It helps to ensure the quality, reliability, and accountability of the ML system, and to comply with the regulatory and ethical standards. Reproducibility is the ability to recreate the same results and outcomes using the same data, models, and parameters. It helps to verify the validity, consistency, and robustness of the ML system, and to debug and improve the performance. Explainability is the ability to understand and interpret the logic, behavior, and outcomes of the ML system. It helps to increase the transparency, trust, and confidence of the ML system, and to identify and mitigate any potential biases, errors, or risks. The other options are not as relevant or comprehensive as this option. Redaction is the process of removing sensitive or confidential information from the data or documents, but it is not a factor that the ML engineer should consider before building the model, as it is more related to the data preparation and protection. Federated learning is a technique that allows training ML models on decentralized data without transferring the data to a central server, but it is not a factor that the ML engineer should consider before building the model, as it is more related to the model architecture and privacy preservation. Differential privacy is a method that adds noise to the data or the model outputs to protect the individual privacy of the data subjects, but it is not a factor that the ML engineer should consider before building the model, as it is more related to the model evaluation and deployment.
Reference: Responsible AI documentation
Traceability documentation
Reproducibility documentation
Explainability documentation
You work for a large hotel chain and have been asked to assist the marketing team in gathering predictions for a targeted marketing strategy. You need to make predictions about user lifetime value (LTV) over the next 30 days so that marketing can be adjusted accordingly. The customer dataset is in BigQuery, and you are preparing the tabular data for training with AutoML Tables. This data has a time signal that is spread across multiple columns.
How should you ensure that AutoML fits the best model to your data?
- A . Manually combine all columns that contain a time signal into an array Allow AutoML to interpret this array appropriately Choose an automatic data split across the training, validation, and testing sets
- B . Submit the data for training without performing any manual transformations Allow AutoML to handle the appropriate transformations Choose an automatic data split across the training, validation, and testing sets
- C . Submit the data for training without performing any manual transformations, and indicate an appropriate column as the Time column Allow AutoML to split your data based on the time signal provided, and reserve the more recent data for the validation and testing sets
- D . Submit the data for training without performing any manual transformations Use the columns that have a time signal to manually split your data Ensure that the data in your validation set is from 30 days after the data in your training set and that the data in your testing set is from 30 days after your validation set
C
Explanation:
This answer is correct because it allows AutoML Tables to handle the time signal in the data and split the data accordingly. This ensures that the model is trained on the historical data and evaluated on the more recent data, which is consistent with the prediction task. AutoML Tables can automatically detect and handle temporal features in the data, such as date, time, and duration. By specifying the Time column, AutoML Tables can also perform time-series forecasting and use the time signal to generate additional features, such as seasonality and trend.
Reference: [AutoML Tables: Preparing your training data]
[AutoML Tables: Time-series forecasting]
Register each user with a user ID on the Firebase Cloud Messaging server, which sends a notification when your model predicts that a user’s account balance will drop below the $25 threshold
Explanation:
This answer is correct because it uses Firebase, a platform that provides a scalable and reliable notification system for mobile and web applications. Firebase Cloud Messaging (FCM) allows you to send messages and notifications to users across different devices and platforms. By registering each user with a user ID on the FCM server, you can target specific users based on their account balance predictions and send them personalized notifications when their balance is likely to drop below the $25 threshold. This way, you can provide a useful and timely feature for your customers and increase their engagement and retention.
Reference: [Firebase Cloud Messaging]
[Firebase Cloud Messaging: Send messages to specific devices]
You have trained a text classification model in TensorFlow using Al Platform. You want to use the trained model for batch predictions on text data stored in BigQuery while minimizing computational overhead.
What should you do?
- A . Export the model to BigQuery ML.
- B . Deploy and version the model on Al Platform.
- C . Use Dataflow with the SavedModel to read the data from BigQuery
- D . Submit a batch prediction job on Al Platform that points to the model location in Cloud Storage.
D
Explanation:
This answer is correct because it allows you to use the trained TensorFlow model for batch predictions on text data stored in BigQuery without any additional processing or overhead. Al Platform provides a service for running batch prediction jobs that can take input data from BigQuery or Cloud Storage and write the output to BigQuery or Cloud Storage. You can use the SavedModel format to export your TensorFlow model to Cloud Storage and then submit a batch prediction job that points to the model location and the input data location. Al Platform will handle the scaling and distribution of the prediction requests and return the results in the specified output location.
Reference: [Al Platform: Batch prediction overview]
[Al Platform: Exporting a SavedModel for prediction]
Dispatch an appropriately sized shuttle and provide the map with the required stops based on the simulated outcome.
Explanation:
This answer is correct because it uses a regression model to estimate the number of passengers at each shuttle station, which is a continuous variable. A tree-based regression model can handle both numerical and categorical features, such as the time of day, the location of the station, and the weather conditions. Based on the predicted number of passengers, the organization can dispatch a shuttle that has enough capacity and provide a map that shows the required stops. This way, the organization can optimize the shuttle service route and reduce the waiting time and fuel consumption.
Reference: [Tree-based regression models]
You need to build classification workflows over several structured datasets currently stored in BigQuery. Because you will be performing the classification several times, you want to complete the following steps without writing code: exploratory data analysis, feature selection, model building, training, and hyperparameter tuning and serving.
What should you do?
- A . Configure AutoML Tables to perform the classification task
- B . Run a BigQuery ML task to perform logistic regression for the classification
- C . Use Al Platform Notebooks to run the classification model with pandas library
- D . Use Al Platform to run the classification model job configured for hyperparameter tuning
A
Explanation:
AutoML Tables is a service that allows you to automatically build and deploy state-of-the-art machine learning models on structured data without writing code. You can use AutoML Tables to perform the following steps for the classification task:
Exploratory data analysis: AutoML Tables provides a graphical user interface (GUI) and a command-line interface (CLI) to explore your data, visualize statistics, and identify potential issues.
Feature selection: AutoML Tables automatically selects the most relevant features for your model based on the data schema and the target column. You can also manually exclude or include features, or create new features from existing ones using feature engineering.
Model building: AutoML Tables automatically builds and evaluates multiple machine learning models using different algorithms and architectures. You can also specify the optimization objective, the budget, and the evaluation metric for your model.
Training and hyperparameter tuning: AutoML Tables automatically trains and tunes your model using the best practices and techniques from Google’s research and engineering teams. You can monitor the training progress and the performance of your model on the GUI or the CLI.
Serving: AutoML Tables automatically deploys your model to a fully managed, scalable, and secure environment. You can use the GUI or the CLI to request predictions from your model, either online (synchronously) or offline (asynchronously).
Reference: [AutoML Tables documentation]
[AutoML Tables overview]
[AutoML Tables how-to guides]
You recently joined an enterprise-scale company that has thousands of datasets. You know that there are accurate descriptions for each table in BigQuery, and you are searching for the proper BigQuery table to use for a model you are building on AI Platform.
How should you find the data that you need?
- A . Use Data Catalog to search the BigQuery datasets by using keywords in the table description.
- B . Tag each of your model and version resources on AI Platform with the name of the BigQuery table that was used for training.
- C . Maintain a lookup table in BigQuery that maps the table descriptions to the table ID. Query the lookup table to find the correct table ID for the data that you need.
- D . Execute a query in BigQuery to retrieve all the existing table names in your project using the INFORMATION_SCHEMA metadata tables that are native to BigQuery. Use the result o find the table that you need.
A
Explanation:
Data Catalog is a fully managed and scalable metadata management service that allows you to quickly discover, manage, and understand your data in Google Cloud. You can use Data Catalog to search the BigQuery datasets by using keywords in the table description, as well as other metadata attributes such as table name, column name, labels, tags, and more. Data Catalog also provides a rich browsing experience that lets you explore the schema, preview the data, and access the BigQuery console directly from the Data Catalog UI. Data Catalog helps you find the data that you need for your model building on AI Platform without writing any code or queries.
Reference: [Data Catalog documentation]
[Data Catalog overview]
[Searching for data assets]
You are working on a classification problem with time series data and achieved an area under the receiver operating characteristic curve (AUC ROC) value of 99% for training data after just a few experiments. You haven’t explored using any sophisticated algorithms or spent any time on hyperparameter tuning.
What should your next step be to identify and fix the problem?
- A . Address the model overfitting by using a less complex algorithm.
- B . Address data leakage by applying nested cross-validation during model training.
- C . Address data leakage by removing features highly correlated with the target value.
- D . Address the model overfitting by tuning the hyperparameters to reduce the AUC ROC value.
B
Explanation:
Data leakage is a problem where information from outside the training dataset is used to create the model, resulting in an overly optimistic or invalid estimate of the model performance. Data leakage can occur in time series data when the temporal order of the data is not preserved during data preparation or model evaluation. For example, if the data is shuffled before splitting into train and test sets, or if future data is used to impute missing values in past data, then data leakage can occur. One way to address data leakage in time series data is to apply nested cross-validation during model training. Nested cross-validation is a technique that allows you to perform both model selection and model evaluation in a robust way, while preserving the temporal order of the data. Nested cross-validation involves two levels of cross-validation: an inner loop for model selection and an outer loop for model evaluation. The inner loop splits the training data into k folds, trains and tunes the model on k-1 folds, and validates the model on the remaining fold. The inner loop repeats this process for each fold and selects the best model based on the validation performance. The outer loop splits the data into n folds, trains the best model from the inner loop on n-1 folds, and tests the model on the remaining fold. The outer loop repeats this process for each fold and evaluates the model performance based on the test results.
Nested cross-validation can help to avoid data leakage in time series data by ensuring that the model is trained and tested on non-overlapping data, and that the data used for validation is never seen by the model during training. Nested cross-validation can also provide a more reliable estimate of the model performance than a single train-test split or a simple cross-validation, as it reduces the variance and bias of the estimate.
Reference: Data Leakage in Machine Learning
How to Avoid Data Leakage When Performing Data Preparation Classification on a single time series – prevent leakage between train and test
You work for an online travel agency that also sells advertising placements on its website to other companies.
You have been asked to predict the most relevant web banner that a user should see next. Security is important to your company. The model latency requirements are 300ms@p99, the inventory is thousands of web banners, and your exploratory analysis has shown that navigation context is a good predictor. You want to Implement the simplest solution.
How should you configure the prediction pipeline?
- A . Embed the client on the website, and then deploy the model on AI Platform Prediction.
- B . Embed the client on the website, deploy the gateway on App Engine, and then deploy the model on AI Platform Prediction.
- C . Embed the client on the website, deploy the gateway on App Engine, deploy the database on Cloud Bigtable for writing and for reading the user’s navigation context, and then deploy the model on AI Platform Prediction.
- D . Embed the client on the website, deploy the gateway on App Engine, deploy the database on Memorystore for writing and for reading the user’s navigation context, and then deploy the model on Google Kubernetes Engine.
A
Explanation:
In this scenario, the goal is to predict the most relevant web banner that a user should see next on an online travel agency’s website. The model needs to have low latency requirements of 300ms@p99, and there are thousands of web banners to choose from. The exploratory analysis has shown that the navigation context is a good predictor. Security is also important to the company. Given these requirements, the best configuration for the prediction pipeline would be to embed the client on the website and deploy the model on AI Platform Prediction.
Option A is the correct answer.
Option A: Embed the client on the website, and then deploy the model on AI Platform Prediction. This option is the simplest solution that meets the requirements. The client can collect the user’s navigation context and send it to the model deployed on AI Platform Prediction for prediction. AI Platform Prediction can handle large-scale prediction requests and has low latency requirements. This option does not require any additional infrastructure or services, making it the simplest solution.
Option B: Embed the client on the website, deploy the gateway on App Engine, and then deploy the model on AI Platform Prediction. This option adds an additional layer of infrastructure by deploying the gateway on App Engine. While App Engine can handle large-scale requests, it adds complexity to the pipeline and may not be necessary for this use case.
Option C: Embed the client on the website, deploy the gateway on App Engine, deploy the database on Cloud Bigtable for writing and for reading the user’s navigation context, and then deploy the model on AI Platform Prediction. This option adds even more complexity to the pipeline by deploying the database on Cloud Bigtable. While Cloud Bigtable can provide fast and scalable access to the user’s navigation context, it may not be needed for this use case. Moreover, Cloud Bigtable may introduce additional latency and cost to the pipeline.
Option D: Embed the client on the website, deploy the gateway on App Engine, deploy the database on Memorystore for writing and for reading the user’s navigation context, and then deploy the model on Google Kubernetes Engine. This option is the most complex and costly solution that does not meet the requirements. Deploying the model on Google Kubernetes Engine requires more management and configuration than AI Platform Prediction. Moreover, Google Kubernetes Engine may not be able to meet the low latency requirements of 300ms@p99. Deploying the database on Memorystore also adds unnecessary overhead and cost to the pipeline.
Reference: AI Platform Prediction documentation
App Engine documentation
Cloud Bigtable documentation
[Memorystore documentation]
[Google Kubernetes Engine documentation]
Your team is building a convolutional neural network (CNN)-based architecture from scratch. The preliminary experiments running on your on-premises CPU-only infrastructure were encouraging, but have slow convergence. You have been asked to speed up model training to reduce time-to-market. You want to experiment with virtual machines (VMs) on Google Cloud to leverage more powerful hardware. Your code does not include any manual device placement and has not been wrapped in Estimator model-level abstraction.
Which environment should you train your model on?
- A . AVM on Compute Engine and 1 TPU with all dependencies installed manually.
- B . AVM on Compute Engine and 8 GPUs with all dependencies installed manually.
- C . A Deep Learning VM with an n1-standard-2 machine and 1 GPU with all libraries pre-installed.
- D . A Deep Learning VM with more powerful CPU e2-highcpu-16 machines with all libraries pre-installed.
C
Explanation:
In this scenario, the goal is to speed up model training for a CNN-based architecture on Google Cloud. The code does not include any manual device placement and has not been wrapped in Estimator model-level abstraction. Given these constraints, the best environment to train the model on would be a Deep Learning VM with an n1-standard-2 machine and 1 GPU with all libraries pre-installed.
Option C is the correct answer.
Option C: A Deep Learning VM with an n1-standard-2 machine and 1 GPU with all libraries pre-installed. This option is the most suitable for the scenario because it provides a ready-to-use environment for deep learning on Google Cloud. A Deep Learning VM is a specialized VM image that is pre-installed with popular deep learning frameworks such as TensorFlow, PyTorch, Keras, and more. A Deep Learning VM also comes with NVIDIA GPU drivers and CUDA libraries that enable GPU acceleration for model training. A Deep Learning VM can be easily configured and launched from the Google Cloud Console or the Cloud SDK. An n1-standard-2 machine is a general-purpose machine type that provides 2 vCPUs and 7.5 GB of memory. This machine type can be sufficient for running a CNN-based architecture. A GPU is a specialized hardware accelerator that can speed up the computation of matrix operations and convolutions, which are common in CNN-based architectures. By using a Deep Learning VM with an n1-standard-2 machine and 1 GPU, the model training can be significantly faster than on an on-premises CPU-only infrastructure.
Option A: A VM on Compute Engine and 1 TPU with all dependencies installed manually. This option is not suitable for the scenario because it requires manual installation of dependencies and device placement. A TPU is a custom-designed ASIC that can provide high performance and efficiency for TensorFlow models. However, to use a TPU, the code needs to include manual device placement and be wrapped in Estimator model-level abstraction. Moreover, to use a TPU, the dependencies such as TensorFlow, Cloud TPU Client, and Cloud Storage need to be installed manually on the VM. This option can be complex and time-consuming to set up and may not be compatible with the existing code.
Option B: A VM on Compute Engine and 8 GPUs with all dependencies installed manually. This option is not suitable for the scenario because it requires manual installation of dependencies and may not be cost-effective. While using 8 GPUs can provide high parallelism and speed for model training, it also increases the cost and complexity of the environment. Moreover, to use GPUs, the dependencies such as NVIDIA GPU drivers, CUDA libraries, and deep learning frameworks need to be installed manually on the VM. This option can be tedious and error-prone to set up and may not be necessary for the scenario.
Option D: A Deep Learning VM with more powerful CPU e2-highcpu-16 machines with all libraries pre-installed. This option is not suitable for the scenario because it does not leverage GPU acceleration for model training. While using more powerful CPU machines can provide more compute resources and memory for model training, it may not be as fast and efficient as using GPU machines. CPU machines are not optimized for matrix operations and convolutions, which are common in CNN-based architectures. Moreover, using more powerful CPU machines can also increase the cost of the environment. This option can be suboptimal and wasteful for the scenario.
Reference: Deep Learning VM Image documentation
Compute Engine documentation
Cloud TPU documentation
Machine types documentation
GPUs on Compute Engine documentation
You work on a growing team of more than 50 data scientists who all use AI Platform. You are designing a strategy to organize your jobs, models, and versions in a clean and scalable way.
Which strategy should you choose?
- A . Set up restrictive IAM permissions on the AI Platform notebooks so that only a single user or group can access a given instance.
- B . Separate each data scientist’s work into a different project to ensure that the jobs, models, and versions created by each data scientist are accessible only to that user.
- C . Use labels to organize resources into descriptive categories. Apply a label to each created resource so that users can filter the results by label when viewing or monitoring the resources.
- D . Set up a BigQuery sink for Cloud Logging logs that is appropriately filtered to capture information about AI Platform resource usage. In BigQuery, create a SQL view that maps users to the resources they are using
C
Explanation:
Labels are key-value pairs that you can attach to AI Platform resources such as jobs, models, and versions. Labels can help you organize your resources into descriptive categories that reflect your business needs. For example, you can use labels to indicate the owner, purpose, environment, or status of a resource. You can also use labels to filter the results when you list or monitor your resources on the Google Cloud Console or the Cloud SDK. Using labels can help you manage your resources in a clean and scalable way, without requiring separate projects or restrictive permissions.
Reference: Using labels to organize AI Platform resources
Creating and managing labels
You work for a credit card company and have been asked to create a custom fraud detection model based on historical data using AutoML Tables. You need to prioritize detection of fraudulent transactions while minimizing false positives.
Which optimization objective should you use when training the model?
- A . An optimization objective that minimizes Log loss
- B . An optimization objective that maximizes the Precision at a Recall value of 0.50
- C . An optimization objective that maximizes the area under the precision-recall curve (AUC PR) value
- D . An optimization objective that maximizes the area under the receiver operating characteristic curve (AUC ROC) value
C
Explanation:
In this scenario, the goal is to create a custom fraud detection model using AutoML Tables. Fraud detection is a type of binary classification problem, where the model needs to predict whether a transaction is fraudulent or not. The optimization objective is a metric that defines how the model is trained and evaluated. AutoML Tables allows you to choose from different optimization objectives for binary classification problems, such as Log loss, Precision at a Recall value, AUC PR, and AUC ROC.
To choose the best optimization objective for fraud detection, we need to consider the characteristics of the problem and the data. Fraud detection is a problem where the positive class (fraudulent transactions) is very rare compared to the negative class (legitimate transactions). This means that the data is highly imbalanced, and the model needs to be sensitive to the minority class. Moreover, fraud detection is a problem where the cost of false negatives (missing a fraudulent transaction) is much higher than the cost of false positives (flagging a legitimate transaction as fraudulent). This means that the model needs to have high recall (the ability to detect all fraudulent transactions) while maintaining high precision (the ability to avoid false alarms).
Given these considerations, the best optimization objective for fraud detection is the one that maximizes the area under the precision-recall curve (AUC PR) value. The AUC PR value is a metric that measures the trade-off between precision and recall for different probability thresholds. A higher AUC PR value means that the model can achieve high precision and high recall at the same time. The AUC PR value is also more suitable for imbalanced data than the AUC ROC value, which measures the trade-off between the true positive rate and the false positive rate. The AUC ROC value can be misleading for imbalanced data, as it can give a high score even if the model has low recall or low precision.
Therefore, option C is the correct answer.
Option A is not suitable, as Log loss is a metric that measures the difference between the predicted probabilities and the actual labels, and does not account for the trade-off between precision and recall.
Option B is not suitable, as Precision at a Recall value is a metric that measures the precision at a fixed recall level, and does not account for the trade-off between precision and recall at different thresholds.
Option D is not suitable, as AUC ROC is a metric that can be misleading for imbalanced data, as explained above.
Reference: AutoML Tables documentation
Optimization objectives for binary classification Precision-Recall Curves: How to Easily Evaluate Machine Learning Models in No Time ROC Curves and Area Under the Curve Explained (video)
Your company manages a video sharing website where users can watch and upload videos. You need to create an ML model to predict which newly uploaded videos will be the most popular so that those videos can be prioritized on your company’s website.
Which result should you use to determine whether the model is successful?
- A . The model predicts videos as popular if the user who uploads them has over 10,000 likes.
- B . The model predicts 97.5% of the most popular clickbait videos measured by number of clicks.
- C . The model predicts 95% of the most popular videos measured by watch time within 30 days of being uploaded.
- D . The Pearson correlation coefficient between the log-transformed number of views after 7 days and 30 days after publication is equal to 0.
C
Explanation:
In this scenario, the goal is to create an ML model to predict which newly uploaded videos will be the most popular on a video sharing website. The result that should be used to determine whether the model is successful is the one that best aligns with the business objective and the evaluation metric.
Option C is the correct answer because it defines the most popular videos as the ones that have the highest watch time within 30 days of being uploaded, and it sets a high accuracy threshold of 95% for the model prediction.
Option C: The model predicts 95% of the most popular videos measured by watch time within 30 days of being uploaded. This option is the best result for the scenario because it reflects the business objective and the evaluation metric. The business objective is to prioritize the videos that will attract and retain the most viewers on the website. The watch time is a good indicator of the viewer engagement and satisfaction, as it measures how long the viewers watch the videos. The 30-day window is a reasonable time frame to capture the popularity trend of the videos, as it accounts for the initial interest and the viral potential of the videos. The 95% accuracy threshold is a high standard for the model prediction, as it means that the model can correctly identify 95 out of 100 of the most popular videos based on the watch time metric.
Option A: The model predicts videos as popular if the user who uploads them has over 10,000 likes. This option is not a good result for the scenario because it does not reflect the business objective or the evaluation metric. The business objective is to prioritize the videos that will be the most popular on the website, not the users who upload them. The number of likes that a user has is not a good indicator of the popularity of their videos, as it does not measure the viewer engagement or satisfaction with the videos. Moreover, this option does not specify a time frame or an accuracy threshold for the model prediction, making it vague and unreliable.
Option B: The model predicts 97.5% of the most popular clickbait videos measured by number of clicks. This option is not a good result for the scenario because it does not reflect the business objective or the evaluation metric. The business objective is to prioritize the videos that will be the most popular on the website, not the videos that have the most misleading or sensational titles or thumbnails. The number of clicks that a video has is not a good indicator of the popularity of the video, as it does not measure the viewer engagement or satisfaction with the video content. Moreover, this option only focuses on the clickbait videos, which may not represent the majority or the diversity of the videos on the website.
Option D: The Pearson correlation coefficient between the log-transformed number of views after 7 days and 30 days after publication is equal to 0. This option is not a good result for the scenario because it does not reflect the business objective or the evaluation metric. The business objective is to prioritize the videos that will be the most popular on the website, not the videos that have the most consistent or inconsistent number of views over time. The Pearson correlation coefficient is a metric that measures the linear relationship between two variables, not the popularity of the videos. A correlation coefficient of 0 means that there is no linear relationship between the log-transformed number of views after 7 days and 30 days, which does not indicate whether the videos are popular or not. Moreover, this option does not specify a threshold or a target value for the correlation coefficient, making it meaningless and irrelevant.
You are working on a Neural Network-based project. The dataset provided to you has columns with different ranges. While preparing the data for model training, you discover that gradient optimization is having difficulty moving weights to a good solution.
What should you do?
- A . Use feature construction to combine the strongest features.
- B . Use the representation transformation (normalization) technique.
- C . Improve the data cleaning step by removing features with missing values.
- D . Change the partitioning step to reduce the dimension of the test set and have a larger training set.
B
Explanation:
Representation transformation (normalization) is a technique that transforms the features to be on a similar scale, such as between 0 and 1, or with mean 0 and standard deviation 1. This technique can improve the performance and training stability of the neural network model, as it can prevent the gradient optimization from being dominated by features with larger scales, and help the model converge faster and better. There are different types of normalization techniques, such as min-max scaling, z-score scaling, log scaling, etc.
You can learn more about normalization techniques from the following web search results:
Normalization | Machine Learning | Google for Developers
NORMALIZATION TECHNIQUES IN TRAINING DNNS: METHODOLOGY, ANALYSIS AND …
Visualizing Different Normalization Techniques | by Dibya … – Medium Data Normalization Techniques: Easy to Advanced (& the Best)
You work for a bank and are building a random forest model for fraud detection. You have a dataset that includes transactions, of which 1% are identified as fraudulent.
Which data transformation strategy would likely improve the performance of your classifier?
- A . Write your data in TFRecords.
- B . Z-normalize all the numeric features.
- C . Oversample the fraudulent transaction 10 times.
- D . Use one-hot encoding on all categorical features.
C
Explanation:
Oversampling is a technique for dealing with imbalanced datasets, where the majority class dominates the minority class. It balances the distribution of classes by increasing the number of samples in the minority class. Oversampling can improve the performance of a classifier by reducing the bias towards the majority class and increasing the sensitivity to the minority class.
In this case, the dataset includes transactions, of which 1% are identified as fraudulent. This means that the fraudulent transactions are the minority class and the non-fraudulent transactions are the majority class. A random forest model trained on this dataset might have a low recall for the fraudulent transactions, meaning that it might miss many of them and fail to detect fraud. This could have a high cost for the bank and its customers.
One way to overcome this problem is to oversample the fraudulent transactions 10 times, meaning that each fraudulent transaction is duplicated 10 times in the training dataset. This would increase the proportion of fraudulent transactions from 1% to about 10%, making the dataset more balanced. This would also make the random forest model more aware of the patterns and features that distinguish fraudulent transactions from non-fraudulent ones, and thus improve its accuracy and recall for the minority class.
For more information about oversampling and other techniques for imbalanced data, see the following references:
Random Oversampling and Undersampling for Imbalanced Classification Exploring Oversampling Techniques for Imbalanced Datasets
You are developing an ML model intended to classify whether X-Ray images indicate bone fracture risk. You have trained on Api Resnet architecture on Vertex AI using a TPU as an accelerator, however you are unsatisfied with the trainning time and use memory usage. You want to quickly iterate your training code but make minimal changes to the code. You also want to minimize impact on the models accuracy.
What should you do?
- A . Configure your model to use bfloat16 instead float32
- B . Reduce the global batch size from 1024 to 256
- C . Reduce the number of layers in the model architecture
- D . Reduce the dimensions of the images used un the model
A
Explanation:
Using bfloat16 instead of float32 can reduce the memory usage and training time of the model, while having minimal impact on the accuracy. Bfloat16 is a 16-bit floating-point format that preserves the range of 32-bit floating-point numbers, but reduces the precision from 24 bits to 8 bits. This means that bfloat16 can store the same magnitude of numbers as float32, but with less detail. Bfloat16 is supported by TPUs and some GPUs, and can be used as a drop-in replacement for float32 in most cases. Bfloat16 can also improve the numerical stability of the model, as it reduces the risk of overflow and underflow errors.
Reducing the global batch size, the number of layers, or the dimensions of the images can also reduce the memory usage and training time of the model, but they can also affect the model’s accuracy and performance. Reducing the global batch size can make the model less stable and converge slower, as it reduces the amount of information available for each gradient update.
Reducing the number of layers can make the model less expressive and powerful, as it reduces the depth and complexity of the network. Reducing the dimensions of the images can make the model less accurate and robust, as it reduces the resolution and quality of the input data.
Reference: Bfloat16: The secret to high performance on Cloud TPUs
Bfloat16 floating-point format
How does Batch Size impact your model learning
Your task is classify if a company logo is present on an image. You found out that 96% of a data does not include a logo. You are dealing with data imbalance problem.
Which metric do you use to evaluate to model?
- A . F1 Score
- B . RMSE
- C . F Score with higher precision weighting than recall
- D . F Score with higher recall weighted than precision
A
Explanation:
The F1 score is a metric that combines both precision and recall, and is suitable for evaluating imbalanced classification problems. Precision measures the fraction of true positives among the predicted positives, and recall measures the fraction of true positives among the actual positives. The F1 score is the harmonic mean of precision and recall, and it ranges from 0 to 1, with higher values indicating better performance. The F1 score is a good metric for imbalanced data because it balances both the false positives and the false negatives, and does not favor the majority class over the minority class.
The other options are not good metrics for imbalanced data. RMSE (root mean squared error) is a metric for regression problems, not classification problems. It measures the average squared difference between the predicted and the actual values, and is not suitable for binary outcomes. F score with higher precision weighting than recall, or F0.5 score, is a metric that gives more importance to precision than recall. This means that it penalizes false positives more than false negatives, which is not desirable for imbalanced data where the minority class is more important. F score with higher recall weighting than precision, or F2 score, is a metric that gives more importance to recall than precision. This means that it penalizes false negatives more than false positives, which might be suitable for some imbalanced data problems, but not for the logo detection problem. In this problem, both false positives and false negatives are equally important, as we want to accurately identify the presence or absence of a logo in an image. Therefore, the F1 score is a better metric than the F2 score.
Reference: Tour of Evaluation Metrics for Imbalanced Classification
Metrics for imbalanced data (simply explained)
You need to train a regression model based on a dataset containing 50,000 records that is stored in BigQuery. The data includes a total of 20 categorical and numerical features with a target variable that can include negative values. You need to minimize effort and training time while maximizing model performance.
What approach should you take to train this regression model?
- A . Create a custom TensorFlow DNN model.
- B . Use BQML XGBoost regression to train the model
- C . Use AutoML Tables to train the model without early stopping.
- D . Use AutoML Tables to train the model with RMSLE as the optimization objective
D
Explanation:
AutoML Tables is a service that allows you to automatically build, analyze, and deploy machine learning models on tabular data. It is suitable for large-scale regression and classification problems, and it supports various optimization objectives, data splitting methods, and hyperparameter tuning algorithms. AutoML Tables can handle both categorical and numerical features, and it can also handle missing values and outliers. AutoML Tables is a good choice for this problem because it minimizes the effort and training time required to train a regression model, while maximizing the model performance.
RMSLE stands for Root Mean Squared Logarithmic Error, and it is a metric that measures the average difference between the logarithm of the predicted values and the logarithm of the actual values. RMSLE is useful for regression problems where the target variable can include negative values, and where large differences between small values are more important than large differences between large values. For example, RMSLE penalizes underestimating a value of 10 by 2 more than overestimating a value of 1000 by 20. RMSLE is a good optimization objective for this problem because it can handle negative values in the target variable, and it can reduce the impact of outliers and large errors.
For more information about AutoML Tables and RMSLE, see the following references:
AutoML Tables: end-to-end workflows on AI Platform Pipelines Predict workload failures before they happen with AutoML Tables How to Calculate RMSE in R
Your data science team has requested a system that supports scheduled model retraining, Docker containers, and a service that supports autoscaling and monitoring for online prediction requests.
Which platform components should you choose for this system?
- A . Vertex AI Pipelines and App Engine
- B . Vertex AI Pipelines and Al Platform Prediction
- C . Cloud Composer, BigQuery ML , and Al Platform Prediction
- D . Cloud Composer, Al Platform Training with custom containers, and App Engine
B
Explanation:
Vertex AI Pipelines and AI Platform Prediction are the platform components that best suit the requirements of the data science team. Vertex AI Pipelines is a service that allows you to orchestrate and automate your machine learning workflows using pipelines. Pipelines are portable and scalable ML workflows that are based on containers. You can use Vertex AI Pipelines to schedule model retraining, use custom containers, and integrate with other Google Cloud services. AI Platform Prediction is a service that allows you to host your trained models and serve online predictions. You can use AI Platform Prediction to deploy models trained on Vertex AI or elsewhere, and benefit from features such as autoscaling, monitoring, logging, and explainability.
Reference: Vertex AI Pipelines
AI Platform Prediction
While monitoring your model training’s GPU utilization, you discover that you have a native synchronous implementation. The training data is split into multiple files. You want to reduce the execution time of your input pipeline.
What should you do?
- A . Increase the CPU load
- B . Add caching to the pipeline
- C . Increase the network bandwidth
- D . Add parallel interleave to the pipeline
D
Explanation:
Parallel interleave is a technique that can improve the performance of the input pipeline by reading and processing data from multiple files in parallel. This can reduce the idle time of the GPU and speed up the training process. Parallel interleave can be implemented using the tf.data.experimental.parallel_interleave () function in TensorFlow, which takes a map function that returns a dataset for each input element, and a cycle length that determines how many input elements are processed concurrently. Parallel interleave can also handle different file sizes and processing times by using a block length argument that controls how many consecutive elements are produced from each input element before switching to another input element. For more information about parallel interleave and how to use it, see the following references:
How to use parallel_interleave in TensorFlow
Better performance with the tf.data API
Your data science team is training a PyTorch model for image classification based on a pre-trained RestNet model. You need to perform hyperparameter tuning to optimize for several parameters.
What should you do?
- A . Convert the model to a Keras model, and run a Keras Tuner job.
- B . Run a hyperparameter tuning job on AI Platform using custom containers.
- C . Create a Kuberflow Pipelines instance, and run a hyperparameter tuning job on Katib.
- D . Convert the model to a TensorFlow model, and run a hyperparameter tuning job on AI Platform.
B
Explanation:
AI Platform supports hyperparameter tuning for PyTorch models using custom containers. This allows you to use any Python dependencies and libraries that are not included in the pre-built AI Platform Training runtime versions. You can also use a pre-trained model such as ResNet as a base for your custom model. To run a hyperparameter tuning job on AI Platform using custom containers, you need to do the following steps:
Create a Dockerfile that defines the container image for your training application. The Dockerfile should install PyTorch and any other dependencies, copy your training code and configuration files, and set the entrypoint for the container.
Build the container image and push it to Container Registry or another accessible registry.
Create a YAML file that defines the configuration for your hyperparameter tuning job. The YAML file should specify the container image URI, the training input and output paths, the hyperparameters to tune, the metric to optimize, and the tuning algorithm and budget.
Submit the hyperparameter tuning job to AI Platform using the gcloud command-line tool or the AI
Platform Training API.
Reference: Hyperparameter tuning overview
Using custom containers
PyTorch on AI Platform Training
You have a large corpus of written support cases that can be classified into 3 separate categories: Technical Support, Billing Support, or Other Issues. You need to quickly build, test, and deploy a service that will automatically classify future written requests into one of the categories.
How should you configure the pipeline?
- A . Use the Cloud Natural Language API to obtain metadata to classify the incoming cases.
- B . Use AutoML Natural Language to build and test a classifier. Deploy the model as a REST API.
- C . Use BigQuery ML to build and test a logistic regression model to classify incoming requests. Use BigQuery ML to perform inference.
- D . Create a TensorFlow model using Google’s BERT pre-trained model. Build and test a classifier, and deploy the model using Vertex AI.
B
Explanation:
AutoML Natural Language is a service that allows you to quickly build, test and deploy natural language processing (NLP) models without needing to have expertise in NLP or machine learning. You can use it to train a classifier on your corpus of written support cases, and then use the AutoML API to perform classification on new requests. Once the model is trained, it can be deployed as a REST API. This allows the classifier to be integrated into your pipeline and be easily consumed by other systems.
You need to quickly build and train a model to predict the sentiment of customer reviews with custom categories without writing code. You do not have enough data to train a model from scratch. The resulting model should have high predictive performance.
Which service should you use?
- A . AutoML Natural Language
- B . Cloud Natural Language API
- C . AI Hub pre-made Jupyter Notebooks
- D . AI Platform Training built-in algorithms
A
Explanation:
AutoML Natural Language is a service that allows you to build and train custom natural language models without writing code. You can use AutoML Natural Language to perform sentiment analysis with custom categories, such as positive, negative, or neutral. You can also use pre-trained models or transfer learning to leverage existing knowledge and reduce the amount of data required to train a model from scratch. AutoML Natural Language provides a user-friendly interface and a powerful AutoML engine that optimizes your model for high predictive performance.
Cloud Natural Language API is a service that provides pre-trained models for common natural language tasks, such as sentiment analysis, entity analysis, and syntax analysis. However, it does not allow you to customize the categories or use your own data for training.
AI Hub pre-made Jupyter Notebooks are interactive documents that contain code, text, and visualizations for various machine learning scenarios. However, they require some coding skills and data preparation to use them effectively.
AI Platform Training built-in algorithms are pre-configured machine learning algorithms that you can use to train models on AI Platform. However, they do not support sentiment analysis as a natural language task.
Reference: AutoML Natural Language documentation
Cloud Natural Language API documentation
AI Hub documentation
AI Platform Training documentation
You need to build an ML model for a social media application to predict whether a user’s submitted profile photo meets the requirements. The application will inform the user if the picture meets the requirements.
How should you build a model to ensure that the application does not falsely accept a non-compliant picture?
- A . Use AutoML to optimize the model’s recall in order to minimize false negatives.
- B . Use AutoML to optimize the model’s F1 score in order to balance the accuracy of false positives and false negatives.
- C . Use Vertex AI Workbench user-managed notebooks to build a custom model that has three times as many examples of pictures that meet the profile photo requirements.
- D . Use Vertex AI Workbench user-managed notebooks to build a custom model that has three times as many examples of pictures that do not meet the profile photo requirements.
A
Explanation:
Recall is the ratio of true positives to the sum of true positives and false negatives. It measures how well the model can identify all the relevant cases. In this scenario, the relevant cases are the pictures that do not meet the profile photo requirements. Therefore, minimizing false negatives means minimizing the cases where the model incorrectly predicts that a non-compliant picture meets the requirements. By using AutoML to optimize the model’s recall, the model will be more likely to reject a non-compliant picture and inform the user accordingly.
Reference: [AutoML Vision] is a service that allows you to train custom ML models for image classification and object detection tasks. You can use AutoML to optimize your model for different metrics, such as recall, precision, or F1 score.
[Recall] is one of the evaluation metrics for ML models. It is defined as TP / (TP + FN), where TP is the
number of true positives and FN is the number of false negatives. Recall measures how well the model can identify all the relevant cases. A high recall means that the model has a low rate of false negatives.
You lead a data science team at a large international corporation. Most of the models your team trains are large-scale models using high-level TensorFlow APIs on AI Platform with GPUs. Your team usually
takes a few weeks or months to iterate on a new version of a model. You were recently asked to review your team’s spending.
How should you reduce your Google Cloud compute costs without impacting the model’s performance?
- A . Use AI Platform to run distributed training jobs with checkpoints.
- B . Use AI Platform to run distributed training jobs without checkpoints.
- C . Migrate to training with Kuberflow on Google Kubernetes Engine, and use preemptible VMs with checkpoints.
- D . Migrate to training with Kuberflow on Google Kubernetes Engine, and use preemptible VMs without checkpoints.
C
Explanation:
Option A is incorrect because using AI Platform to run distributed training jobs with checkpoints does not reduce the compute costs, but rather increases them by using more resources and storing the checkpoints.
Option B is incorrect because using AI Platform to run distributed training jobs without checkpoints may reduce the compute costs, but it also risks losing the progress of the training if the job fails or is interrupted.
Option C is correct because migrating to training with Kubeflow on Google Kubernetes Engine, and using preemptible VMs with checkpoints can reduce the compute costs significantly by using cheaper and more scalable resources, while also preserving the state of the training with checkpoints.
Option D is incorrect because using preemptible VMs without checkpoints may reduce the compute costs, but it also risks losing the training progress if the VMs are preempted.
Reference: Kubeflow on Google Cloud
Using preemptible VMs and GPUs
Saving and loading models
You have deployed a model on Vertex AI for real-time inference. During an online prediction request, you get an “Out of Memory” error.
What should you do?
- A . Use batch prediction mode instead of online mode.
- B . Send the request again with a smaller batch of instances.
- C . Use base64 to encode your data before using it for prediction.
- D . Apply for a quota increase for the number of prediction requests.
B
Explanation:
Option A is incorrect because using batch prediction mode instead of online mode does not solve the “Out of Memory” error, but rather changes the latency and throughput of the prediction service. Batch prediction mode is suitable for large-scale, asynchronous, and non-urgent predictions, while online prediction mode is suitable for low-latency, synchronous, and real-time predictions1.
Option B is correct because sending the request again with a smaller batch of instances can reduce the memory consumption of the prediction service and avoid the “Out of Memory” error. The batch size is the number of instances that are processed together in one request. A smaller batch size means less data to load into memory at once2.
Option C is incorrect because using base64 to encode your data before using it for prediction does not reduce the memory consumption of the prediction service, but rather increases it. Base64 encoding is a way of representing binary data as ASCII characters, which increases the size of the data by about 33%3. Base64 encoding is only required for certain data types, such as images and audio, that cannot be represented as JSON or CSV4.
Option D is incorrect because applying for a quota increase for the number of prediction requests does not solve the “Out of Memory” error, but rather increases the number of requests that can be sent to the prediction service per day. Quotas are limits on the usage of Google Cloud resources, such as CPU, memory, disk, and network5. Quotas do not affect the performance of the prediction service, but rather the availability and cost of the service.
Reference: Choosing between online and batch prediction
Online prediction input data
Base64 encoding
Preparing data for prediction
Quotas and limits
You work at a subscription-based company. You have trained an ensemble of trees and neural networks to predict customer churn, which is the likelihood that customers will not renew their yearly subscription. The average prediction is a 15% churn rate, but for a particular customer the model predicts that they are 70% likely to churn. The customer has a product usage history of 30%, is located in New York City, and became a customer in 1997. You need to explain the difference between the actual prediction, a 70% churn rate, and the average prediction. You want to use Vertex Explainable AI.
What should you do?
- A . Train local surrogate models to explain individual predictions.
- B . Configure sampled Shapley explanations on Vertex Explainable AI.
- C . Configure integrated gradients explanations on Vertex Explainable AI.
- D . Measure the effect of each feature as the weight of the feature multiplied by the feature value.
B
Explanation:
Option A is incorrect because training local surrogate models to explain individual predictions is not a feature of Vertex Explainable AI, but rather a general technique for interpreting black-box models. Local surrogate models are simpler models that approximate the behavior of the original model around a specific input1.
Option B is correct because configuring sampled Shapley explanations on Vertex Explainable AI is a way to explain the difference between the actual prediction and the average prediction for a given input. Sampled Shapley explanations are based on the Shapley value, which is a game-theoretic concept that measures how much each feature contributes to the prediction2. Vertex Explainable AI supports sampled Shapley explanations for tabular data, such as customer churn3.
Option C is incorrect because configuring integrated gradients explanations on Vertex Explainable AI is not suitable for explaining the difference between the actual prediction and the average prediction for a given input. Integrated gradients explanations are based on the idea of computing the gradients of the prediction with respect to the input features along a path from a baseline input to the actual input4. Vertex Explainable AI supports integrated gradients explanations for image and text data, but not for tabular data3.
Option D is incorrect because measuring the effect of each feature as the weight of the feature multiplied by the feature value is not a valid way to explain the difference between the actual prediction and the average prediction for a given input. This method assumes that the model is linear and additive, which is not the case for an ensemble of trees and neural networks. Moreover, this method does not account for the interactions between features or the non-linearity of the model5.
Reference: Local surrogate models
Shapley value
Vertex Explainable AI overview
Integrated gradients
Feature importance
You need to execute a batch prediction on 100 million records in a BigQuery table with a custom TensorFlow DNN regressor model, and then store the predicted results in a BigQuery table. You want to minimize the effort required to build this inference pipeline.
What should you do?
- A . Import the TensorFlow model with BigQuery ML, and run the ml.predict function.
- B . Use the TensorFlow BigQuery reader to load the data, and use the BigQuery API to write the results to BigQuery.
- C . Create a Dataflow pipeline to convert the data in BigQuery to TFRecords. Run a batch inference on Vertex AI Prediction, and write the results to BigQuery.
- D . Load the TensorFlow SavedModel in a Dataflow pipeline. Use the BigQuery I/O connector with a custom function to perform the inference within the pipeline, and write the results to BigQuery.
A
Explanation:
Option A is correct because importing the TensorFlow model with BigQuery ML, and running the ml.predict function is the easiest way to execute a batch prediction on a large BigQuery table with a custom TensorFlow model, and store the predicted results in another BigQuery table. BigQuery ML allows you to import TensorFlow models that are stored in Cloud Storage, and use them for prediction with SQL queries1. The ml.predict function returns a table with the predicted values, which can be saved to another BigQuery table2.
Option B is incorrect because using the TensorFlow BigQuery reader to load the data, and using the BigQuery API to write the results to BigQuery requires more effort to build the inference pipeline than option A. The TensorFlow BigQuery reader is a way to read data from BigQuery into TensorFlow datasets, which can be used for training or prediction3. However, this option also requires writing code to load the TensorFlow model, run the prediction, and use the BigQuery API to write the results back to BigQuery4.
Option C is incorrect because creating a Dataflow pipeline to convert the data in BigQuery to TFRecords, running a batch inference on Vertex AI Prediction, and writing the results to BigQuery requires more effort to build the inference pipeline than option
You are creating a deep neural network classification model using a dataset with categorical input values. Certain columns have a cardinality greater than 10,000 unique values.
How should you encode these categorical values as input into the model?
- A . Convert each categorical value into an integer value.
- B . Convert the categorical string data to one-hot hash buckets.
- C . Map the categorical variables into a vector of boolean values.
- D . Convert each categorical value into a run-length encoded string.
B
Explanation:
Option A is incorrect because converting each categorical value into an integer value is not a good way to encode categorical values with high cardinality. This method implies an ordinal relationship between the categories, which may not be true. For example, assigning the values 1, 2, and 3 to the categories “red”, “green”, and “blue” does not make sense, as there is no inherent order among these colors1.
Option B is correct because converting the categorical string data to one-hot hash buckets is a suitable way to encode categorical values with high cardinality. This method uses a hash function to map each category to a fixed-length vector of binary values, where only one element is 1 and the rest are 0. This method preserves the sparsity and independence of the categories, and reduces the dimensionality of the input space2.
Option C is incorrect because mapping the categorical variables into a vector of boolean values is not a valid way to encode categorical values with high cardinality. This method implies that each category can be represented by a combination of true/false values, which may not be possible for a large number of categories. For example, if there are 10,000 categories, then there are 2^10,000 possible combinations of boolean values, which is impractical to store and process3.
Option D is incorrect because converting each categorical value into a run-length encoded string is not a useful way to encode categorical values with high cardinality. This method compresses a string by replacing consecutive repeated characters with the character and the number of repetitions. For example, “AAAABBBCC” becomes “A4B3C2”. This method does not reduce the dimensionality of the input space, and does not preserve the semantic meaning of the categories4.
Reference: Encoding categorical features
One-hot hash buckets
Boolean vector
Run-length encoding
You need to train a natural language model to perform text classification on product descriptions that contain millions of examples and 100,000 unique words. You want to preprocess the words individually so that they can be fed into a recurrent neural network.
What should you do?
- A . Create a hot-encoding of words, and feed the encodings into your model.
- B . Identify word embeddings from a pre-trained model, and use the embeddings in your model.
- C . Sort the words by frequency of occurrence, and use the frequencies as the encodings in your model.
- D . Assign a numerical value to each word from 1 to 100,000 and feed the values as inputs in your model.
B
Explanation:
Option A is incorrect because creating a one-hot encoding of words, and feeding the encodings into your model is not an efficient way to preprocess the words individually for a natural language model. One-hot encoding is a method of representing categorical variables as binary vectors, where each element corresponds to a category and only one element is 1 and the rest are 01. However, this method is not suitable for high-dimensional and sparse data, such as words in a large vocabulary, because it requires a lot of memory and computation, and does not capture the semantic similarity or relationship between words2.
Option B is correct because identifying word embeddings from a pre-trained model, and using the embeddings in your model is a good way to preprocess the words individually for a natural language model. Word embeddings are low-dimensional and dense vectors that represent the meaning and usage of words in a continuous space3. Word embeddings can be learned from a large corpus of text using neural networks, such as word2vec, GloVe, or BERT4. Using pre-trained word embeddings can save time and resources, and improve the performance of the natural language model, especially when the training data is limited or noisy5.
Option C is incorrect because sorting the words by frequency of occurrence, and using the frequencies as the encodings in your model is not a meaningful way to preprocess the words individually for a natural language model. This method implies that the frequency of a word is a good indicator of its importance or relevance, which may not be true. For example, the word “the” is very frequent but not very informative, while the word “unicorn” is rare but more distinctive. Moreover, this method does not capture the semantic similarity or relationship between words, and may introduce noise or bias into the model.
Option D is incorrect because assigning a numerical value to each word from 1 to 100,000 and feeding the values as inputs in your model is not a valid way to preprocess the words individually for a natural language model. This method implies an ordinal relationship between the words, which may not be true. For example, assigning the values 1, 2, and 3 to the words “apple”, “banana”, and “orange” does not make sense, as there is no inherent order among these fruits. Moreover, this method does not capture the semantic similarity or relationship between words, and may confuse the model with irrelevant or misleading information.
Reference: One-hot encoding
Word embeddings
Word embedding
Pre-trained word embeddings
Using pre-trained word embeddings in a Keras model
[Term frequency]
[Term frequency-inverse document frequency]
[Ordinal variable]
[Encoding categorical features]
Your data science team has requested a system that supports scheduled model retraining, Docker containers, and a service that supports autoscaling and monitoring for online prediction requests.
Which platform components should you choose for this system?
- A . Vertex AI Pipelines and App Engine
- B . Vertex AI Pipelines, Vertex AI Prediction, and Vertex AI Model Monitoring
- C . Cloud Composer, BigQuery ML, and Vertex AI Prediction
- D . Cloud Composer, Vertex AI Training with custom containers, and App Engine
B
Explanation:
Option A is incorrect because Vertex AI Pipelines and App Engine do not meet all the requirements of the system. Vertex AI Pipelines is a service that allows you to create, run, and manage ML workflows using TensorFlow Extended (TFX) components or custom components1. App Engine is a service that allows you to build and deploy scalable web applications using standard or flexible environments2. However, App Engine does not support Docker containers in the standard environment, and does not provide a dedicated service for online prediction and monitoring of ML models3.
Option B is correct because Vertex AI Pipelines, Vertex AI Prediction, and Vertex AI Model Monitoring meet all the requirements of the system. Vertex AI Prediction is a service that allows you to deploy and serve ML models for online or batch prediction, with support for autoscaling and custom containers4. Vertex AI Model Monitoring is a service that allows you to monitor the performance and fairness of your deployed models, and get alerts for any issues or anomalies5.
Option C is incorrect because Cloud Composer, BigQuery ML, and Vertex AI Prediction do not meet all the requirements of the system. Cloud Composer is a service that allows you to create, schedule, and manage workflows using Apache Airflow. BigQuery ML is a service that allows you to create and use ML models within BigQuery using SQL queries. However, BigQuery ML does not support custom containers, and Vertex AI Prediction does not support scheduled model retraining or model monitoring.
Option D is incorrect because Cloud Composer, Vertex AI Training with custom containers, and App Engine do not meet all the requirements of the system. Vertex AI Training is a service that allows you to train ML models using built-in algorithms or custom containers. However, Vertex AI Training does not support online prediction or model monitoring, and App Engine does not support Docker containers in the standard environment or online prediction and monitoring of ML models3.
Reference: Vertex AI Pipelines overview
App Engine overview
Choosing an App Engine environment
Vertex AI Prediction overview
Vertex AI Model Monitoring overview
[Cloud Composer overview]
[BigQuery ML overview]
[BigQuery ML limitations]
[Vertex AI Training overview]
You are profiling the performance of your TensorFlow model training time and notice a performance issue caused by inefficiencies in the input data pipeline for a single 5 terabyte CSV file dataset on Cloud Storage. You need to optimize the input pipeline performance.
Which action should you try first to increase the efficiency of your pipeline?
- A . Preprocess the input CSV file into a TFRecord file.
- B . Randomly select a 10 gigabyte subset of the data to train your model.
- C . Split into multiple CSV files and use a parallel interleave transformation.
- D . Set the reshuffle_each_iteration parameter to true in the tf.data.Dataset.shuffle method.
A
Explanation:
According to the web search results, the TFRecord format is a recommended way to store large amounts of data efficiently and improve the performance of the data input pipeline123. The TFRecord format is a binary format that can be compressed and serialized, which reduces the I/O overhead and the memory footprint of the data1. The tf.data API provides tools to create and read TFRecord files easily1.
The other options are not as effective as option A.
Option B would reduce the amount of data available for training and might affect the model accuracy.
Option C would still require reading from a single CSV file at a time, which might not utilize the full bandwidth of the remote storage.
Option D would only affect the order of the data elements, not the speed of reading them.
Export the batch prediction job outputs from Cloud Storage and import them into BigQuery.
Explanation:
Reasoning: The question asks for a design that serves asynchronous predictions to determine whether a machine part will fail. This means that the predictions do not need to be returned immediately to the sensors, but can be processed in batches and sent to a downstream system for monitoring.
Option B is the only one that uses a streaming data pipeline with Pub/Sub and Dataflow, which can handle real-time data ingestion, processing, and prediction.
Option B also invokes the model for prediction, which is required by the question. The other options either use synchronous predictions (option A), batch predictions (options C and D), or do not invoke the model for prediction (option D).
Reference: You can learn more about the differences between synchronous, asynchronous, and batch predictions in Vertex AI from this document. You can also find examples of how to use Pub/Sub and Dataflow for streaming data pipelines from this tutorial and this codelab.
Your company manages an application that aggregates news articles from many different online sources and sends them to users. You need to build a recommendation model that will suggest articles to readers that are similar to the articles they are currently reading.
Which approach should you use?
- A . Create a collaborative filtering system that recommends articles to a user based on the user’s past behavior.
- B . Encode all articles into vectors using word2vec, and build a model that returns articles based on vector similarity.
- C . Build a logistic regression model for each user that predicts whether an article should be recommended to a user.
- D . Manually label a few hundred articles, and then train an SVM classifier based on the manually classified articles that categorizes additional articles into their respective categories.
B
Explanation:
Option A is incorrect because creating a collaborative filtering system that recommends articles to a user based on the user’s past behavior is not the best approach to suggest articles that are similar to the articles they are currently reading. Collaborative filtering is a method of recommendation that uses the ratings or preferences of other users to predict the preferences of a target user1. However, this method does not consider the content or features of the articles, and may not be able to find articles that are similar in terms of topic, style, or sentiment.
Option B is correct because encoding all articles into vectors using word2vec, and building a model that returns articles based on vector similarity is a suitable approach to suggest articles that are similar to the articles they are currently reading. Word2vec is a technique that learns low-dimensional and dense representations of words from a large corpus of text, such that words that are semantically similar have similar vectors2. By applying word2vec to the articles, we can obtain vector representations of the articles that capture their meaning and usage. Then, we can use a similarity measure, such as cosine similarity, to find articles that have similar vectors to the current article3.
Option C is incorrect because building a logistic regression model for each user that predicts whether an article should be recommended to a user is not a feasible approach to suggest articles that are similar to the articles they are currently reading. Logistic regression is a supervised learning method that models the probability of a binary outcome (such as recommend or not) based on some input features (such as user profile or article content)4. However, this method requires a large amount of labeled data for each user, which may not be available or scalable. Moreover, this method does not directly measure the similarity between articles, but rather the likelihood of a user’s preference.
Option D is incorrect because manually labeling a few hundred articles, and then training an SVM classifier based on the manually classified articles that categorizes additional articles into their respective categories is not an effective approach to suggest articles that are similar to the articles they are currently reading. SVM (support vector machine) is a supervised learning method that finds a hyperplane that separates the data into different classes (such as news categories) with the maximum margin5. However, this method also requires a large amount of labeled data, which may be costly and time-consuming to obtain. Moreover, this method does not account for the fine-grained similarity between articles within the same category, or the cross-category similarity between articles from different categories.
Reference: Collaborative filtering
Word2vec
Cosine similarity
Logistic regression
SVM
You work for a large social network service provider whose users post articles and discuss news. Millions of comments are posted online each day, and more than 200 human moderators constantly review comments and flag those that are inappropriate. Your team is building an ML model to help human moderators check content on the platform. The model scores each comment and flags suspicious comments to be reviewed by a human.
Which metric(s) should you use to monitor the model’s performance?
- A . Number of messages flagged by the model per minute
- B . Number of messages flagged by the model per minute confirmed as being inappropriate by humans.
- C . Precision and recall estimates based on a random sample of 0.1% of raw messages each minute sent to a human for review
- D . Precision and recall estimates based on a sample of messages flagged by the model as potentially inappropriate each minute
D
Explanation:
Precision measures the fraction of messages flagged by the model that are actually inappropriate, while recall measures the fraction of inappropriate messages that are flagged by the model. These metrics are useful for evaluating how well the model can identify and filter out inappropriate comments.
Option A is not a good metric because it does not account for the accuracy of the model. The model might flag many messages that are not inappropriate, or miss many messages that are inappropriate.
Option B is better than option A, but it still does not account for the recall of the model. The model might flag only a few messages that are highly likely to be inappropriate, but miss many other messages that are less obvious but still inappropriate.
Option C is not a good metric because it does not focus on the messages that are flagged by the model. The random sample of 0.1% of raw messages might contain very few inappropriate messages, making the precision and recall estimates unreliable.
You have been given a dataset with sales predictions based on your company’s marketing activities. The data is structured and stored in BigQuery, and has been carefully managed by a team of data analysts. You need to prepare a report providing insights into the predictive capabilities of the data. You were asked to run several ML models with different levels of sophistication, including simple models and multilayered neural networks. You only have a few hours to gather the results of your experiments.
Which Google Cloud tools should you use to complete this task in the most efficient and self-serviced way?
- A . Use BigQuery ML to run several regression models, and analyze their performance.
- B . Read the data from BigQuery using Dataproc, and run several models using SparkML.
- C . Use Vertex AI Workbench user-managed notebooks with scikit-learn code for a variety of ML algorithms and performance metrics.
- D . Train a custom TensorFlow model with Vertex AI, reading the data from BigQuery featuring a variety of ML algorithms.
A
Explanation:
Option A is correct because using BigQuery ML to run several regression models, and analyze their performance is the most efficient and self-serviced way to complete the task. BigQuery ML is a service that allows you to create and use ML models within BigQuery using SQL queries1. You can use BigQuery ML to run different types of regression models, such as linear regression, logistic regression, or DNN regression2. You can also use BigQuery ML to analyze the performance of your models, such as the mean squared error, the accuracy, or the ROC curve3. BigQuery ML is fast, scalable, and easy to use, as it does not require any data movement, coding, or additional tools4.
Option B is incorrect because reading the data from BigQuery using Dataproc, and running several models using SparkML is not the most efficient and self-serviced way to complete the task. Dataproc is a service that allows you to create and manage clusters of virtual machines that run Apache Spark and other open-source tools5. SparkML is a library that provides ML algorithms and utilities for Spark. However, this option requires more effort and resources than option A, as it involves moving the data from BigQuery to Dataproc, creating and configuring the clusters, writing and running the SparkML code, and analyzing the results.
Option C is incorrect because using Vertex AI Workbench user-managed notebooks with scikit-learn code for a variety of ML algorithms and performance metrics is not the most efficient and self-serviced way to complete the task. Vertex AI Workbench is a service that allows you to create and use notebooks for ML development and experimentation. Scikit-learn is a library that provides ML algorithms and utilities for Python. However, this option also requires more effort and resources than option A, as it involves creating and managing the notebooks, writing and running the scikit-learn code, and analyzing the results.
Option D is incorrect because training a custom TensorFlow model with Vertex AI, reading the data from BigQuery featuring a variety of ML algorithms is not the most efficient and self-serviced way to complete the task. TensorFlow is a framework that allows you to create and train ML models using Python or other languages. Vertex AI is a service that allows you to train and deploy ML models using built-in algorithms or custom containers. However, this option also requires more effort and resources than option A, as it involves writing and running the TensorFlow code, creating and managing the training jobs, and analyzing the results.
Reference: BigQuery ML overview
Creating a model in BigQuery ML
Evaluating a model in BigQuery ML
BigQuery ML benefits
Dataproc overview
[SparkML overview]
[Vertex AI Workbench overview]
[Scikit-learn overview]
[TensorFlow overview]
[Vertex AI overview]
You are an ML engineer at a bank. You have developed a binary classification model using AutoML Tables to predict whether a customer will make loan payments on time. The output is used to approve or reject loan requests. One customer’s loan request has been rejected by your model, and the bank’s risks department is asking you to provide the reasons that contributed to the model’s decision.
What should you do?
- A . Use local feature importance from the predictions.
- B . Use the correlation with target values in the data summary page.
- C . Use the feature importance percentages in the model evaluation page.
- D . Vary features independently to identify the threshold per feature that changes the classification.
A
Explanation:
Option A is correct because using local feature importance from the predictions is the best way to provide the reasons that contributed to the model’s decision for a specific customer’s loan request. Local feature importance is a measure of how much each feature affects the prediction for a given instance, relative to the average prediction for the dataset1. AutoML Tables provides local feature importance values for each prediction, which can be accessed using the Vertex AI SDK for Python or the Cloud Console2. By using local feature importance, you can explain why the model rejected the loan request based on the customer’s data.
Option B is incorrect because using the correlation with target values in the data summary page is not a good way to provide the reasons that contributed to the model’s decision for a specific customer’s loan request. The correlation with target values is a measure of how much each feature is linearly related to the target variable for the entire dataset, not for a single instance3. The data summary page in AutoML Tables shows the correlation with target values for each feature, as well as other statistics such as mean, standard deviation, and histogram4. However, these statistics are not useful for explaining the model’s decision for a specific customer, as they do not account for the interactions between features or the non-linearity of the model.
Option C is incorrect because using the feature importance percentages in the model evaluation page is not a good way to provide the reasons that contributed to the model’s decision for a specific customer’s loan request. The feature importance percentages are a measure of how much each feature affects the overall accuracy of the model for the entire dataset, not for a single instance5. The model evaluation page in AutoML Tables shows the feature importance percentages for each feature, as well as other metrics such as precision, recall, and confusion matrix. However, these metrics are not useful for explaining the model’s decision for a specific customer, as they do not reflect the individual contribution of each feature for a given prediction.
Option D is incorrect because varying features independently to identify the threshold per feature that changes the classification is not a feasible way to provide the reasons that contributed to the model’s decision for a specific customer’s loan request. This method involves changing the value of one feature at a time, while keeping the other features constant, and observing how the prediction changes. However, this method is not practical, as it requires making multiple prediction requests, and may not capture the interactions between features or the non-linearity of the model.
Reference: Local feature importance
Getting local feature importance values
Correlation with target values
Data summary page
Feature importance percentages
[Model evaluation page]
[Varying features independently]
You work for a magazine distributor and need to build a model that predicts which customers will renew their subscriptions for the upcoming year. Using your company’s historical data as your training set, you created a TensorFlow model and deployed it to AI Platform. You need to determine which customer attribute has the most predictive power for each prediction served by the model.
What should you do?
- A . Use AI Platform notebooks to perform a Lasso regression analysis on your model, which will eliminate features that do not provide a strong signal.
- B . Stream prediction results to BigQuery. Use BigQuery’s CORR (X1, X2) function to calculate the Pearson correlation coefficient between each feature and the target variable.
- C . Use the AI Explanations feature on AI Platform. Submit each prediction request with the ‘explain’ keyword to retrieve feature attributions using the sampled Shapley method.
- D . Use the What-If tool in Google Cloud to determine how your model will perform when individual features are excluded. Rank the feature importance in order of those that caused the most significant performance drop when removed from the model.
C
Explanation:
Option A is incorrect because using AI Platform notebooks to perform a Lasso regression analysis on your model, which will eliminate features that do not provide a strong signal, is not a suitable way to determine which customer attribute has the most predictive power for each prediction served by the model. Lasso regression is a method of feature selection that applies a penalty to the coefficients of the linear model, and shrinks them to zero for irrelevant features1. However, this method assumes that the model is linear and additive, which may not be the case for a TensorFlow model. Moreover, this method does not provide feature attributions for each prediction, but rather for the entire dataset.
Option B is incorrect because streaming prediction results to BigQuery, and using BigQuery’s CORR(X1, X2) function to calculate the Pearson correlation coefficient between each feature and the target variable, is not a valid way to determine which customer attribute has the most predictive power for each prediction served by the model. The Pearson correlation coefficient is a measure of the linear relationship between two variables, ranging from -1 to 12. However, this method does not account for the interactions between features or the non-linearity of the model. Moreover, this method does not provide feature attributions for each prediction, but rather for the entire dataset.
Option C is correct because using the AI Explanations feature on AI Platform, and submitting each prediction request with the ‘explain’ keyword to retrieve feature attributions using the sampled Shapley method, is the best way to determine which customer attribute has the most predictive power for each prediction served by the model. AI Explanations is a service that allows you to get feature attributions for your deployed models on AI Platform3. Feature attributions are values that indicate how much each feature contributed to the prediction for a given instance4. The sampled Shapley method is a technique that uses the Shapley value, a game-theoretic concept, to measure the contribution of each feature to the prediction5. By using AI Explanations, you can get feature attributions for each prediction request, and identify the most important features for each customer.
Option D is incorrect because using the What-If tool in Google Cloud to determine how your model will perform when individual features are excluded, and ranking the feature importance in order of those that caused the most significant performance drop when removed from the model, is not a practical way to determine which customer attribute has the most predictive power for each prediction served by the model. The What-If tool is a tool that allows you to visualize and analyze your ML models and datasets. However, this method requires manually editing or removing features for each instance, and observing the change in the prediction. This method is not scalable or efficient, and may not capture the interactions between features or the non-linearity of the model.
Reference: Lasso regression
Pearson correlation coefficient
AI Explanations overview
Feature attributions
Sampled Shapley method
[What-If tool overview]
You are working on a binary classification ML algorithm that detects whether an image of a classified scanned document contains a company’s logo. In the dataset, 96% of examples don’t have the logo, so the dataset is very skewed.
Which metrics would give you the most confidence in your model?
- A . F-score where recall is weighed more than precision
- B . RMSE
- C . F1 score
- D . F-score where precision is weighed more than recall
A
Explanation:
Option A is correct because using F-score where recall is weighed more than precision is a suitable metric for binary classification with imbalanced data. F-score is a harmonic mean of precision and recall, which are two metrics that measure the accuracy and completeness of the positive class1. Precision is the fraction of true positives among all predicted positives, while recall is the fraction of true positives among all actual positives1. When the data is imbalanced, the positive class is the minority class, which is usually the class of interest. For example, in this case, the positive class is the images that contain the company’s logo, which are rare but important to detect. By weighing recall more than precision, we can emphasize the importance of finding all the positive examples, even if some false positives are included2.
Option B is incorrect because using RMSE (root mean squared error) is not a valid metric for binary classification with imbalanced data. RMSE is a metric that measures the average magnitude of the errors between the predicted and actual values3. RMSE is suitable for regression problems, where the target variable is continuous, not for classification problems, where the target variable is discrete4.
Option C is incorrect because using F1 score is not the best metric for binary classification with imbalanced data. F1 score is a special case of F-score where precision and recall are equally weighted1. F1 score is suitable for balanced data, where the positive and negative classes are equally important and frequent5. However, for imbalanced data, the positive class is more important and less frequent than the negative class, so F1 score may not reflect the performance of the model well2.
Option D is incorrect because using F-score where precision is weighed more than recall is not a good metric for binary classification with imbalanced data. By weighing precision more than recall, we can emphasize the importance of minimizing the false positives, even if some true positives are missed2. However, for imbalanced data, the true positives are more important and less frequent than the false positives, so this metric may not reflect the performance of the model well2.
Reference: Precision, recall, and F-measure
F-score for imbalanced data
RMSE
Regression vs classification
F1 score
[Imbalanced classification]
[Binary classification]
You work on the data science team for a multinational beverage company. You need to develop an ML model to predict the company’s profitability for a new line of naturally flavored bottled waters in different locations. You are provided with historical data that includes product types, product sales volumes, expenses, and profits for all regions.
What should you use as the input and output for your model?
- A . Use latitude, longitude, and product type as features. Use profit as model output.
- B . Use latitude, longitude, and product type as features. Use revenue and expenses as model outputs.
- C . Use product type and the feature cross of latitude with longitude, followed by binning, as features.
Use profit as model output. - D . Use product type and the feature cross of latitude with longitude, followed by binning, as features. Use revenue and expenses as model outputs.
C
Explanation:
Option A is incorrect because using latitude, longitude, and product type as features, and using profit as model output is not the best way to develop an ML model to predict the company’s profitability for a new line of naturally flavored bottled waters in different locations. This option does not capture the interaction between latitude and longitude, which may affect the profitability of the product. For example, the same product may have different profitability in different regions, depending on the climate, culture, or preferences of the customers. Moreover, this option does not account for the granularity of the location data, which may be too fine or too coarse for the model. For example, using the exact coordinates of a city may not be meaningful, as the profitability may vary within the city, or using the country name may not be informative, as the profitability may vary across the country.
Option B is incorrect because using latitude, longitude, and product type as features, and using revenue and expenses as model outputs is not a suitable way to develop an ML model to predict the company’s profitability for a new line of naturally flavored bottled waters in different locations. This option has the same drawbacks as option A, as it does not capture the interaction between latitude and longitude, or account for the granularity of the location data. Moreover, this option does not directly predict the profitability of the product, which is the target variable of interest. Instead, it predicts the revenue and expenses of the product, which are intermediate variables that depend on other factors, such as the price, the cost, or the demand of the product. To obtain the profitability, we would need to subtract the expenses from the revenue, which may introduce errors or uncertainties in the prediction.
Option C is correct because using product type and the feature cross of latitude with longitude, followed by binning, as features, and using profit as model output is a good way to develop an ML model to predict the company’s profitability for a new line of naturally flavored bottled waters in different locations. This option captures the interaction between latitude and longitude, which may affect the profitability of the product, by creating a feature cross of these two features. A feature cross is a synthetic feature that combines the values of two or more features into a single feature1. This option also accounts for the granularity of the location data, by binning the feature cross into discrete buckets. Binning is a technique that groups continuous values into intervals, which can reduce the noise and complexity of the data2. Moreover, this option directly predicts the profitability of the product, which is the target variable of interest, by using it as the model output.
Option D is incorrect because using product type and the feature cross of latitude with longitude, followed by binning, as features, and using revenue and expenses as model outputs is not a valid way to develop an ML model to predict the company’s profitability for a new line of naturally flavored bottled waters in different locations. This option has the same advantages as option C, as it captures the interaction between latitude and longitude, and accounts for the granularity of the location data, by creating a feature cross and binning it. However, this option does not directly predict the profitability of the product, which is the target variable of interest, but rather predicts the revenue and expenses of the product, which are intermediate variables that depend on other factors, as explained in option B.
Reference: Feature cross
Binning
[Profitability]
[Revenue and expenses]
[Latitude and longitude]
[Product type]
You work as an ML engineer at a social media company, and you are developing a visual filter for users’ profile photos. This requires you to train an ML model to detect bounding boxes around human faces. You want to use this filter in your company’s iOS-based mobile phone application. You want to minimize code development and want the model to be optimized for inference on mobile phones.
What should you do?
- A . Train a model using AutoML Vision and use the “export for Core ML” option.
- B . Train a model using AutoML Vision and use the “export for Coral” option.
- C . Train a model using AutoML Vision and use the “export for TensorFlow.js” option.
- D . Train a custom TensorFlow model and convert it to TensorFlow Lite (TFLite).
A
Explanation:
AutoML Vision is a Google Cloud service that allows you to train custom ML models for image classification, object detection, and segmentation without writing any code. You can use AutoML Vision to upload your training data, label it, and train a model using a graphical user interface. You can also evaluate the model’s performance and export it for deployment. One of the export options is Core ML, which is a framework that lets you integrate ML models into iOS applications. Core ML optimizes the model for on-device performance, power efficiency, and minimal memory footprint. By using AutoML Vision and Core ML, you can minimize code development and have a model that is optimized for inference on mobile phones.
Reference: AutoML Vision documentation
Core ML documentation
You have been asked to build a model using a dataset that is stored in a medium-sized (~10 GB) BigQuery table. You need to quickly determine whether this data is suitable for model development. You want to create a one-time report that includes both informative visualizations of data distributions and more sophisticated statistical analyses to share with other ML engineers on your team. You require maximum flexibility to create your report.
What should you do?
- A . Use Vertex AI Workbench user-managed notebooks to generate the report.
- B . Use the Google Data Studio to create the report.
- C . Use the output from TensorFlow Data Validation on Dataflow to generate the report.
- D . Use Dataprep to create the report.
A
Explanation:
Option A is correct because using Vertex AI Workbench user-managed notebooks to generate the report is the best way to quickly determine whether the data is suitable for model development, and to create a one-time report that includes both informative visualizations of data distributions and more sophisticated statistical analyses to share with other ML engineers on your team. Vertex AI Workbench is a service that allows you to create and use notebooks for ML development and experimentation. You can use Vertex AI Workbench to connect to your BigQuery table, query and analyze the data using SQL or Python, and create interactive charts and plots using libraries such as pandas, matplotlib, or seaborn. You can also use Vertex AI Workbench to perform more advanced data analysis, such as outlier detection, feature engineering, or hypothesis testing, using libraries such as TensorFlow Data Validation, TensorFlow Transform, or SciPy. You can export your notebook as a PDF or HTML file, and share it with your team. Vertex AI Workbench provides maximum flexibility to create your report, as you can use any code or library that you want, and customize the report as you wish.
Option B is incorrect because using Google Data Studio to create the report is not the most flexible way to quickly determine whether the data is suitable for model development, and to create a one-time report that includes both informative visualizations of data distributions and more sophisticated statistical analyses to share with other ML engineers on your team. Google Data Studio is a service that allows you to create and share interactive dashboards and reports using data from various sources, such as BigQuery, Google Sheets, or Google Analytics. You can use Google Data Studio to connect to your BigQuery table, explore and visualize the data using charts, tables, or maps, and apply filters, calculations, or aggregations to the data. However, Google Data Studio does not support more sophisticated statistical analyses, such as outlier detection, feature engineering, or hypothesis testing, which may be useful for model development. Moreover, Google Data Studio is more suitable for creating recurring reports that need to be updated frequently, rather than one-time reports that are static.
Option C is incorrect because using the output from TensorFlow Data Validation on Dataflow to generate the report is not the most efficient way to quickly determine whether the data is suitable for model development, and to create a one-time report that includes both informative visualizations of data distributions and more sophisticated statistical analyses to share with other ML engineers on your team. TensorFlow Data Validation is a library that allows you to explore, validate, and monitor the quality of your data for ML. You can use TensorFlow Data Validation to compute descriptive statistics, detect anomalies, infer schemas, and generate data visualizations for your data. Dataflow is a service that allows you to create and run scalable data processing pipelines using Apache Beam. You can use Dataflow to run TensorFlow Data Validation on large datasets, such as those stored in BigQuery. However, this option is not very efficient, as it involves moving the data from BigQuery to Dataflow, creating and running the pipeline, and exporting the results. Moreover, this option does not provide maximum flexibility to create your report, as you are limited by the functionalities of TensorFlow Data Validation, and you may not be able to customize the report as you wish.
Option D is incorrect because using Dataprep to create the report is not the most flexible way to quickly determine whether the data is suitable for model development, and to create a one-time report that includes both informative visualizations of data distributions and more sophisticated statistical analyses to share with other ML engineers on your team. Dataprep is a service that allows you to explore, clean, and transform your data for analysis or ML. You can use Dataprep to connect to your BigQuery table, inspect and profile the data using histograms, charts, or summary statistics, and apply transformations, such as filtering, joining, splitting, or aggregating, to the data. However, Dataprep does not support more sophisticated statistical analyses, such as outlier detection, feature engineering, or hypothesis testing, which may be useful for model development. Moreover, Dataprep is more suitable for creating data preparation workflows that need to be executed repeatedly, rather than one-time reports that are static.
Reference: Vertex AI Workbench documentation
Google Data Studio documentation
TensorFlow Data Validation documentation
Dataflow documentation
Dataprep documentation
[BigQuery documentation]
[pandas documentation]
[matplotlib documentation]
[seaborn documentation]
[TensorFlow Transform documentation]
[SciPy documentation]
[Apache Beam documentation]
You work on an operations team at an international company that manages a large fleet of on-premises servers located in few data centers around the world. Your team collects monitoring data from the servers, including CPU/memory consumption. When an incident occurs on a server, your team is responsible for fixing it. Incident data has not been properly labeled yet. Your management team wants you to build a predictive maintenance solution that uses monitoring data from the VMs to detect potential failures and then alerts the service desk team.
What should you do first?
- A . Train a time-series model to predict the machines’ performance values. Configure an alert if a machine’s actual performance values significantly differ from the predicted performance values.
- B . Implement a simple heuristic (e.g., based on z-score) to label the machines’ historical performance data. Train a model to predict anomalies based on this labeled dataset.
- C . Develop a simple heuristic (e.g., based on z-score) to label the machines’ historical performance data. Test this heuristic in a production environment.
- D . Hire a team of qualified analysts to review and label the machines’ historical performance data.
Train a model based on this manually labeled dataset.
B
Explanation:
Option A is incorrect because training a time-series model to predict the machines’ performance values, and configuring an alert if a machine’s actual performance values significantly differ from the predicted performance values, is not the best way to build a predictive maintenance solution that uses monitoring data from the VMs to detect potential failures and then alerts the service desk team. This option assumes that the performance values follow a predictable pattern, which may not be the case for complex systems. Moreover, this option does not use any historical incident data,
which may contain useful information for identifying failures. Furthermore, this option does not involve any model evaluation or validation, which are essential steps for ensuring the quality and reliability of the model.
Option B is correct because implementing a simple heuristic (e.g., based on z-score) to label the machines’ historical performance data, and training a model to predict anomalies based on this labeled dataset, is a reasonable way to build a predictive maintenance solution that uses monitoring data from the VMs to detect potential failures and then alerts the service desk team. This option uses a simple and fast method to label the historical performance data, which is necessary for supervised learning. A z-score is a measure of how many standard deviations a value is away from the mean of a distribution1. By using a z-score, we can label the performance values that are unusually high or low as anomalies, which may indicate failures. Then, we can train a model to learn the patterns of normal and anomalous performance values, and use it to predict anomalies on new data. We can also evaluate and validate the model using metrics such as precision, recall, or F1-score, and compare it with other models or methods.
Option C is incorrect because developing a simple heuristic (e.g., based on z-score) to label the machines’ historical performance data, and testing this heuristic in a production environment, is not a safe way to build a predictive maintenance solution that uses monitoring data from the VMs to detect potential failures and then alerts the service desk team. This option does not involve any model training or evaluation, which are essential steps for ensuring the quality and reliability of the solution. Moreover, this option does not test the heuristic on a separate dataset, such as a validation or test set, before deploying it to production, which may lead to errors or failures in the production environment.
Option D is incorrect because hiring a team of qualified analysts to review and label the machines’ historical performance data, and training a model based on this manually labeled dataset, is not a feasible way to build a predictive maintenance solution that uses monitoring data from the VMs to detect potential failures and then alerts the service desk team. This option may produce high-quality labels, but it is also costly, time-consuming, and prone to human errors or biases. Moreover, this option may not scale well with large or complex datasets, which may require more analysts or more time to label.
Reference: Z-score
[Predictive maintenance]
[Anomaly detection]
[Time-series analysis]
[Model evaluation]
You are developing an ML model that uses sliced frames from video feed and creates bounding boxes around specific objects. You want to automate the following steps in your training pipeline: ingestion and preprocessing of data in Cloud Storage, followed by training and hyperparameter tuning of the object model using Vertex AI jobs, and finally deploying the model to an endpoint. You want to orchestrate the entire pipeline with minimal cluster management.
What approach should you use?
- A . Use Kubeflow Pipelines on Google Kubernetes Engine.
- B . Use Vertex AI Pipelines with TensorFlow Extended (TFX) SDK.
- C . Use Vertex AI Pipelines with Kubeflow Pipelines SDK.
- D . Use Cloud Composer for the orchestration.
B
Explanation:
Option A is incorrect because using Kubeflow Pipelines on Google Kubernetes Engine is not the most convenient way to orchestrate the entire pipeline with minimal cluster management. Kubeflow Pipelines is an open-source platform that allows you to build, run, and manage ML pipelines using containers1. Google Kubernetes Engine is a service that allows you to create and manage clusters of virtual machines that run Kubernetes, an open-source system for orchestrating containerized applications2. However, this option requires more effort and resources than option B, as it involves creating and configuring the clusters, installing and maintaining Kubeflow Pipelines, and writing and running the pipeline code.
Option B is correct because using Vertex AI Pipelines with TensorFlow Extended (TFX) SDK is the best way to orchestrate the entire pipeline with minimal cluster management. Vertex AI Pipelines is a service that allows you to create and run scalable and portable ML pipelines on Google Cloud3. TensorFlow Extended (TFX) is a framework that provides a set of components and libraries for building production-ready ML pipelines using TensorFlow4. You can use Vertex AI Pipelines with TFX SDK to ingest and preprocess the data in Cloud Storage, train and tune the object model using Vertex AI jobs, and deploy the model to an endpoint, using predefined or custom components.
Vertex AI Pipelines handles the underlying infrastructure and orchestration for you, so you don’t need to worry about cluster management or scalability.
Option C is incorrect because using Vertex AI Pipelines with Kubeflow Pipelines SDK is not the most suitable way to orchestrate the entire pipeline with minimal cluster management. Kubeflow Pipelines SDK is a library that allows you to build and run ML pipelines using Kubeflow Pipelines5. You can use Vertex AI Pipelines with Kubeflow Pipelines SDK to create and run ML pipelines on Google Cloud, using containers. However, this option is less convenient and consistent than option B, as it requires you to use different APIs and tools for different steps of the pipeline, such as Vertex AI SDK for training and deployment, and Kubeflow Pipelines SDK for ingestion and preprocessing. Moreover, this option does not leverage the benefits of TFX, such as the standard components, the metadata store, or the ML Metadata library.
Option D is incorrect because using Cloud Composer for the orchestration is not the most efficient way to orchestrate the entire pipeline with minimal cluster management. Cloud Composer is a service that allows you to create and run workflows using Apache Airflow, an open-source platform for orchestrating complex tasks. You can use Cloud Composer to orchestrate the entire pipeline, by creating and managing DAGs (directed acyclic graphs) that define the dependencies and order of the tasks. However, this option is more complex and costly than option B, as it involves creating and configuring the environments, installing and maintaining Airflow, and writing and running the DAGs.
Reference: Kubeflow Pipelines documentation
Google Kubernetes Engine documentation
Vertex AI Pipelines documentation
TensorFlow Extended documentation
Kubeflow Pipelines SDK documentation
[Cloud Composer documentation]
[Vertex AI documentation]
[Cloud Storage documentation]
[TensorFlow documentation]
You are training an object detection machine learning model on a dataset that consists of three million X-ray images, each roughly 2 GB in size. You are using Vertex AI Training to run a custom training application on a Compute Engine instance with 32-cores, 128 GB of RAM, and 1 NVIDIA P100 GPU. You notice that model training is taking a very long time. You want to decrease training time without sacrificing model performance.
What should you do?
- A . Increase the instance memory to 512 GB and increase the batch size.
- B . Replace the NVIDIA P100 GPU with a v3-32 TPU in the training job.
- C . Enable early stopping in your Vertex AI Training job.
- D . Use the tf.distribute.Strategy API and run a distributed training job.
You are a data scientist at an industrial equipment manufacturing company. You are developing a regression model to estimate the power consumption in the company’s manufacturing plants based on sensor data collected from all of the plants. The sensors collect tens of millions of records every day. You need to schedule daily training runs for your model that use all the data collected up to the current date. You want your model to scale smoothly and require minimal development work.
What should you do?
- A . Develop a custom TensorFlow regression model, and optimize it using Vertex Al Training.
- B . Develop a regression model using BigQuery ML.
- C . Develop a custom scikit-learn regression model, and optimize it using Vertex Al Training
- D . Develop a custom PyTorch regression model, and optimize it using Vertex Al Training
B
Explanation:
BigQuery ML is a powerful tool that allows you to build and deploy machine learning models directly within BigQuery, Google’s fully-managed, serverless data warehouse. It allows you to create regression models using SQL, which is a familiar and easy-to-use language for many data scientists. It also allows you to scale smoothly and require minimal development work since you don’t have to worry about cluster management and it’s fully-managed by Google.
BigQuery ML also allows you to run your training on the same data where it’s stored, this will minimize data movement, and thus minimize cost and time.
Reference: BigQuery ML
BigQuery ML for regression
BigQuery ML for scalability