Google Associate Android Developer Google Developers Certification – Associate Android Developer (Kotlin and Java Exam) Online Training
Google Associate Android Developer Online Training
The questions for Associate Android Developer were last updated at Feb 10,2026.
- Exam Code: Associate Android Developer
- Exam Name: Google Developers Certification - Associate Android Developer (Kotlin and Java Exam)
- Certification Provider: Google
- Latest update: Feb 10,2026
What is illustrated in the picture?
- A . Logcat window with filter settings
- B . Debugging native code using LLDB
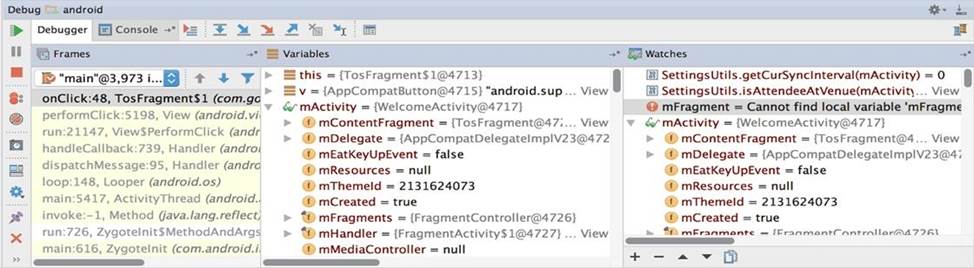
- C . The Variables and Watches panes in the Debugger window
- D . The Breakpoints window lists all the current breakpoints and includes behavior settings for each
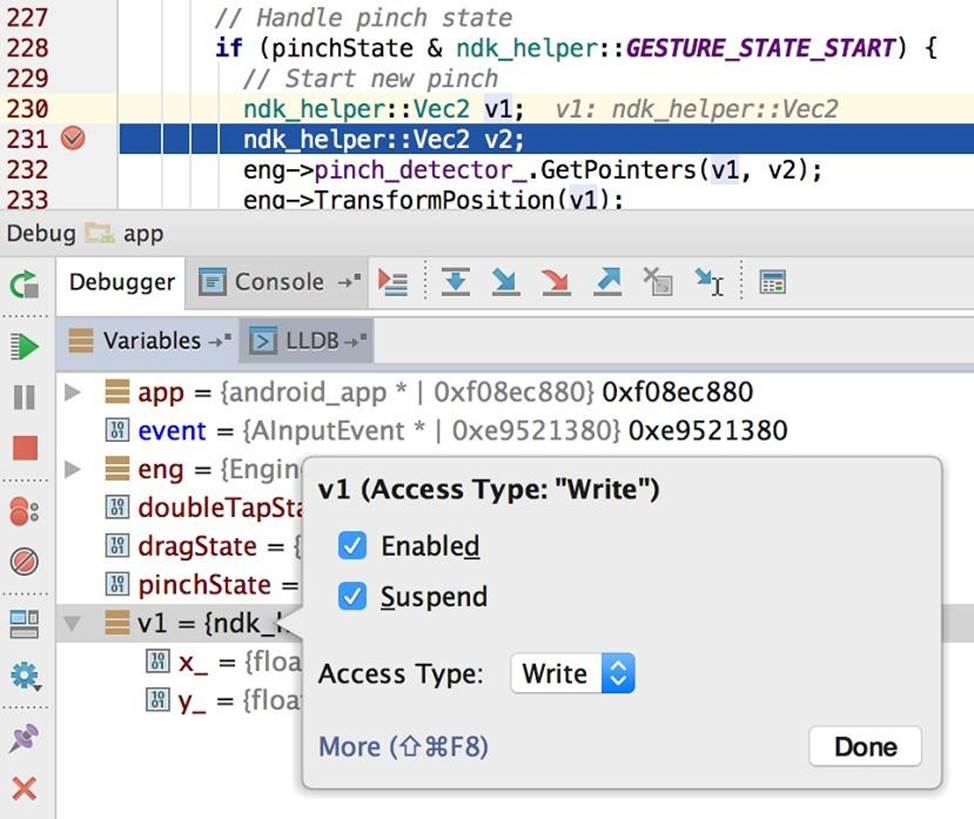
- E . Adding a watchpoint to a variable in memory
What is illustrated in the picture?
- A . Logcat window with filter settings
- B . Debugging native code using LLDB
- C . The Variables and Watches panes in the Debugger window
- D . The Breakpoints window lists all the current breakpoints and includes behavior settings for each
- E . Adding a watchpoint to a variable in memory
When your code execution reaches the breakpoint, Android Studio pauses execution of your app. You can then use the tools in the Debugger tab to identify the state of the app.
![]()
With Step Into you can
- A . examine the object tree for a variable, expand it in the Variables view. If the Variables view is not visible
- B . evaluate an expression at the current execution point
- C . advance to the next line in the code (without entering a method)
- D . advance to the first line inside a method call
- E . advance to the next line outside the current method
- F . continue running the app normally
When your code execution reaches the breakpoint, Android Studio pauses execution of your app. You can then use the tools in the Debugger tab to identify the state of the app.
![]()
With Evaluate Expression you can
- A . examine the object tree for a variable; expand it in the Variables view
- B . evaluate an expression at the current execution point
- C . advance to the next line in the code (without entering a method)
- D . advance to the first line inside a method call
- E . advance to the next line outside the current method
- F . continue running the app normally
When your code execution reaches the breakpoint, Android Studio pauses execution of your app. You can then use the tools in the Debugger tab to identify the state of the app.
![]()
With Step Over you can
- A . examine the object tree for a variable; expand it in the Variables view.
- B . evaluate an expression at the current execution point
- C . advance to the next line in the code (without entering a method)
- D . advance to the first line inside a method call
- E . advance to the next line outside the current method
- F . continue running the app normally
When your code execution reaches the breakpoint, Android Studio pauses execution of your app. You can then use the tools in the Debugger tab to identify the state of the app.
![]()
With Step Out you can
- A . examine the object tree for a variable; expand it in the Variables view. If the Variables view is not visible
- B . evaluate an expression at the current execution point
- C . advance to the next line in the code (without entering a method)
- D . advance to the first line inside a method call
- E . advance to the next line outside the current method
- F . continue running the app normally
The Log class allows you to create log messages that appear in logcat. Generally, you could use the following log methods: (Choose five.)
- A . Log.e(String, String) (error)
- B . Log.a(String, String) (all outputs)
- C . Log.w(String, String) (warning)
- D . Log.i(String, String) (information)
- E . Log.q(String, String) (Question:s)
- F . Log.d(String, String) (debug)
- G . Log.v(String, String) (verbose)
Filter logcat messages. If in the filter menu, a filter option “Show only selected application”? means:
- A . Display the messages produced by the app code only (the default). Logcat filters the log messages using the PID of the active app.
- B . Apply no filters. Logcat displays all log messages from the device, regardless of which process you selected.
- C . Create or modify a custom filter. For example, you could create a filter to view log messages from two apps at the same time.
Filter logcat messages. If in the filter menu, a filter option “Edit Filter Configuration”? means:
- A . Display the messages produced by the app code only (the default). Logcat filters the log messages
using the PID of the active app. - B . Apply no filters. Logcat displays all log messages from the device, regardless of which process you selected.
- C . Create or modify a custom filter. For example, you could create a filter to view log messages from two apps at the same time.
The Layout Inspector in Android Studio allows you to compare your app layout with design mockups, display a magnified or 3D view of your app, and examine details of its layout at runtime.
When this is especially useful?
- A . when your layout is built entirely in XML rather than runtime and the layout is behaving expectedly.
- B . when your layout is built at runtime rather than entirely in XML and the layout is behaving unexpectedly.
Latest Associate Android Developer Dumps Valid Version with 107 Q&As
Latest And Valid Q&A | Instant Download | Once Fail, Full Refund
