DELL EMC D-DS-FN-23 Dell Data Science Foundations 2023 Online Training
DELL EMC D-DS-FN-23 Online Training
The questions for D-DS-FN-23 were last updated at Jan 30,2025.
- Exam Code: D-DS-FN-23
- Exam Name: Dell Data Science Foundations 2023
- Certification Provider: DELL EMC
- Latest update: Jan 30,2025
You received 100,000 home loan records and want to quickly determine if there is any correlation between mortgage age and mortgage amount before conducting advanced analysis.
Which tool should be used for the preliminary analysis?
- A . Scatter plot
- B . Stacked Bar chart
- C . Box and Whisker plot
- D . Histogram
What is the output of the K-means clustering algorithm?
- A . Centroid positioning and entropy of each record in each cluster
- B . Center of each discovered cluster and mapping of each record to a cluster
- C . Two dimensional representation of the data and the clusters
- D . Intercept and coefficients for each input variable in the dataset
You are provided with the following list.
Which window function is missing?
cume_dist()
dense_rank()
rank()
percent_rank()
first_value()
last_value()
lag()
lead()
ntile()
- A . row_preceding()
- B . row_number()
- C . median()
- D . cumulative_sum()
In text analysis, what makes the corpus representation dynamic?
- A . Algorithms used to determine the classification or tagging
- B . Search and retrieval process for finding the document that meets the search criteria
- C . Inherent high dimensionality in the problem of text analysis
- D . Requirement to update index and corpus metrics continuously
How are window functions different from regular aggregate functions?
- A . Rows retain their separate identities and the window function can access more than the current row.
- B . Rows are grouped into an output row and the window function can access more than the current row.
- C . Rows retain their separate identities and the window function can only access the current row.
- D . Rows are grouped into an output row and the window function can only access the current row.
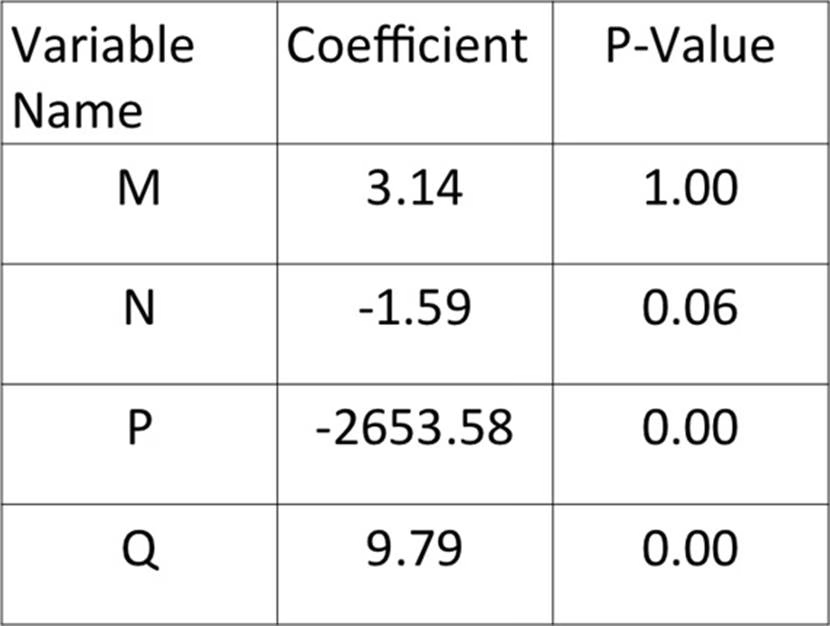
You have created a Linear Regression model to predict total sales based on variables M, N, P and Q as shown in the graphic. You originally expected all variables to have positive coefficients.

Which action would you take?
- A . Accept all variables and begin model validation steps against holdout data
- B . Accept only positive variables and investigate potential correlation with the dependent variable
- C . Accept only statistically significant variables and investigate correlated independent variables
- D . Accept none of the variables and investigate correlations between all variables
You have been assigned to do a study of the daily revenue effect of a pricing model of online transactions. All the data currently available to you has been loaded into your analytics database; revenue data, pricing data, and online transaction data.
You find that all the data comes in different levels of granularity. The transaction data has timestamps (day, hour, minutes, seconds), pricing is stored at the daily level, and revenue data is only reported monthly.
What is your next step?
- A . Report back to the business owner that the current data model does not support the business question.
- B . Interpolate a daily model for revenue from the monthly revenue data.
- C . Aggregate all data to the monthly level in order to create a monthly revenue model.
- D . Disregard revenue as a driver in the pricing model, and create a daily model based on pricing and transactions only.
Which key role for a successful analytic project can provide business domain expertise with a deep understanding of the data and key performance indicators?
- A . Business Intelligence Analyst
- B . Project Manager
- C . Project Sponsor
- D . Business User
A Data Scientist is assigned to build a model from a reporting data warehouse. The warehouse contains data collected from many sources and transformed through a complex, multi-stage ETL process.
What is a concern the data scientist should have about the data?
- A . It is too processed
- B . It is not structured
- C . It is not normalized
- D . It is too centralized
You have just completed the Discovery phase of a project and finished interviewing the main stakeholders. You have identified the necessary data feeds and are now beginning to set up the analytic sandbox.
What is the next step?
- A . Assess data quality
- B . Perform ELT / ETL
- C . Create data visualizations
- D . Run descriptive statistics for several data sets
Latest D-DS-FN-23 Dumps Valid Version with 300 Q&As
Latest And Valid Q&A | Instant Download | Once Fail, Full Refund

