A project sponsor asked the PM to provide a summary of the current financial status.
The PM uses the following burn up chart for the analysis:
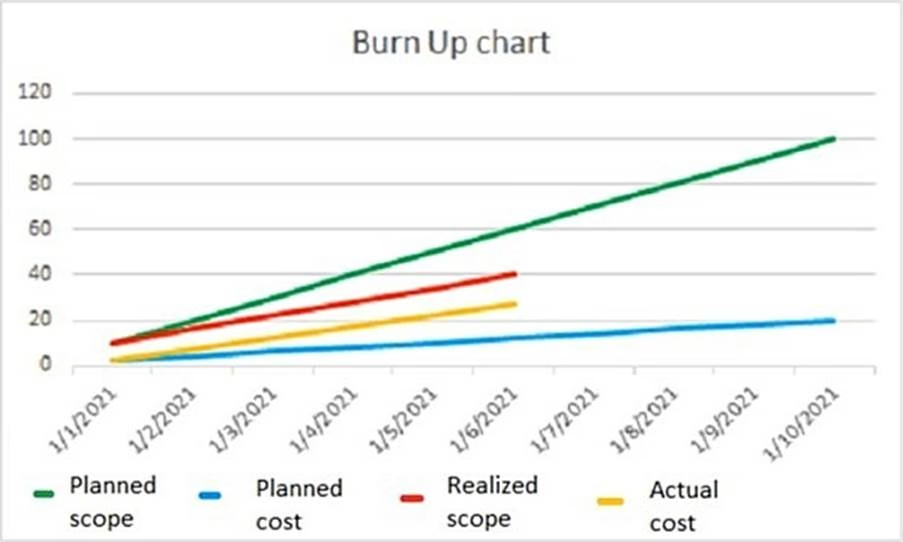
Based on the chart, which of the following is the current status of the project?
A . Behind schedule and over budget
B . Behind schedule and under budget
C . Ahead of schedule and over budget
D . Ahead of schedule and under budget
Answer: A
Explanation:
The project manager can use the burn up chart to analyze the current status of the project based on its scope (value delivered), budget (cost), and schedule (time). A burn up chart is a graphical tool that shows how much work has been completed (burned up) versus how much work remains (scope) over time. It also shows how much budget has been spent (burned up) versus how much budget remains (budget) over time. A burn up chart can help to monitor and control the project progress and performance and identify any variances or deviations from the plan. The chart given shows that both scope and budget lines are above their respective target lines at any given time point. This means that less work has been completed than planned (scope variance) and more money has been spent than planned (budget variance) at any given time point. Therefore, the project is behind schedule and over budget.
Latest PK0-005 Dumps Valid Version with 81 Q&As
Latest And Valid Q&A | Instant Download | Once Fail, Full Refund
