What metrics about API invocations are available for visualization in custom charts using Anypoint Analytics?
A . Request size, request HTTP verbs, response time
B . Request size, number of requests, JDBC Select operation result set size
C . Request size, number of requests, response size, response time
D . Request size, number of requests, JDBC Select operation response time
Answer: C
Explanation:
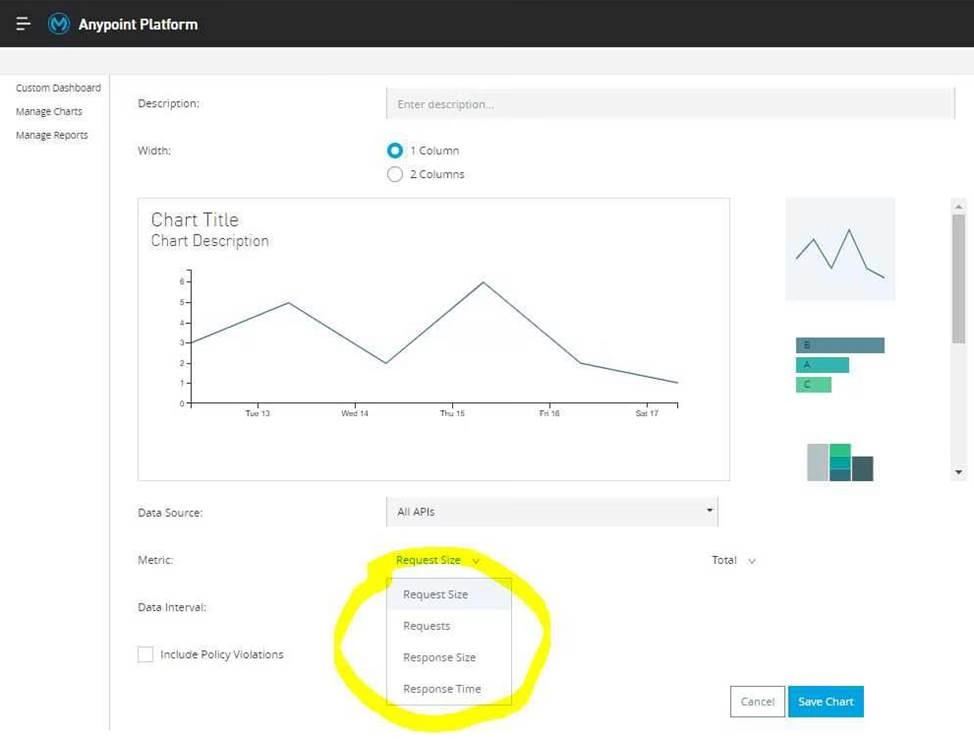
Correct answer is Request size, number of requests, response size, response time Analytics API Analytics can provide insight into how your APIs are being used and how they are performing. From API Manager, you can access the Analytics dashboard, create a custom dashboard, create and manage charts, and create reports. From API Manager, you can get following types of analytics: – API viewing analytics – API events analytics – Charted metrics in API Manager It can be accessed using: http://anypoint.mulesoft.com/analytics
API Analytics provides a summary in chart form of requests, top apps, and latency for a particular duration.
The custom dashboard in Anypoint Analytics contains a set of charts for a single API or for all APIs Each chart displays various API characteristics
C Requests size: Line chart representing size of requests in KBs
C Requests: Line chart representing number of requests over a period
C Response size: Line chart representing size of response in KBs
C Response time: Line chart representing response time in ms
* To check this, You can go to API Manager > Analytics > Custom Dashboard > Edit Dashboard > Create Chart > Metric
Reference: https://docs.mulesoft.com/monitoring/api-analytics-dashboard
Additional Information:
The default dashboard contains a set of charts
C Requests by date: Line chart representing number of requests
C Requests by location: Map chart showing the number of requests for each country of origin
C Requests by application: Bar chart showing the number of requests from each of the top five registered applications
C Requests by platform: Ring chart showing the number of requests broken down by platform
Latest MuleSoft Integration Architect I Dumps Valid Version with 244 Q&As
Latest And Valid Q&A | Instant Download | Once Fail, Full Refund
