A firm sells an average of 2,000 units of snacks from its existing stock while it waits for orders to be delivered. Demand during lead time varies in accordance with a normal distribution.
The firm’s supply manager prepares a presentation to explain the concept of customer service and safety stock levels using the following figure:
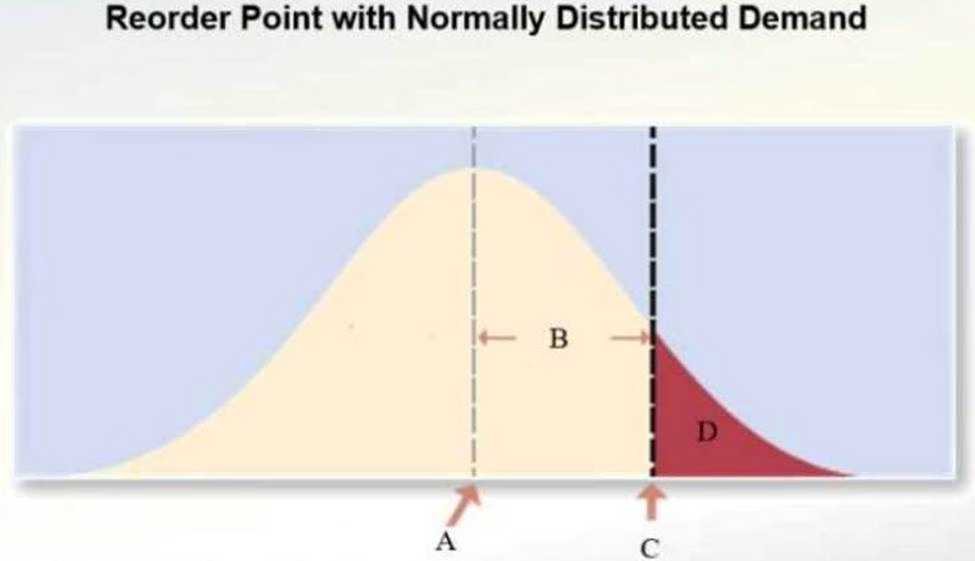
What does the shaded area D (in red) represent?
A . Average demand during lead-time
B . Service level
C . Stock-out risk
D . Re-order point
Answer: C
Explanation:
The shaded area D represents the probability of running out of stock during lead time, indicating the level of risk if safety stock is insufficient. Proper safety stock levels are crucial to minimize stock-outs and ensure service reliability.
Reference: Chopra, S., & Meindl, P. (2016). Supply Chain Management: Strategy, Planning, and Operation.
Latest INTE Dumps Valid Version with 167 Q&As
Latest And Valid Q&A | Instant Download | Once Fail, Full Refund
