Which three actions should you perform in sequence?
Topic 1, Case Study 1
Overview
You are a data scientist in a company that provides data science for professional sporting events.
Models will be global and local market data to meet the following business goals:
• Understand sentiment of mobile device users at sporting events based on audio from crowd reactions.
• Access a user’s tendency to respond to an advertisement.
• Customize styles of ads served on mobile devices.
• Use video to detect penalty events.
Current environment
Requirements
• Media used for penalty event detection will be provided by consumer devices. Media may include images and videos captured during the sporting event and snared using social media. The images and videos will have varying sizes and formats.
• The data available for model building comprises of seven years of sporting event media. The sporting event media includes: recorded videos, transcripts of radio commentary, and logs from related social media feeds feeds captured during the sporting events.
• Crowd sentiment will include audio recordings submitted by event attendees in both mono and stereo Formats.
Advertisements
• Ad response models must be trained at the beginning of each event and applied during the sporting event.
• Market segmentation nxxlels must optimize for similar ad resporr.r history.
• Sampling must guarantee mutual and collective exclusivity local and global segmentation models that share the same features.
• Local market segmentation models will be applied before determining a user’s propensity to respond to an advertisement.
• Data scientists must be able to detect model degradation and decay.
• Ad response models must support non linear boundaries features.
• The ad propensity model uses a cut threshold is 0.45 and retrains occur if weighted Kappa deviates from 0.1 +/-5%.
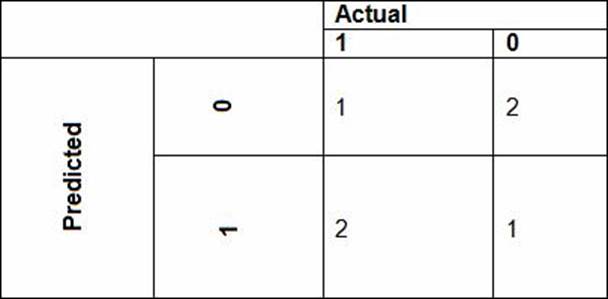
• The ad propensity model uses cost factors shown in the following diagram:

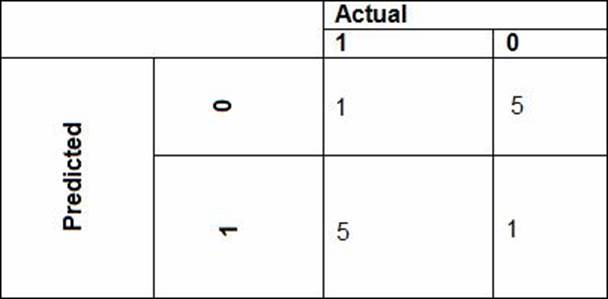
• The ad propensity model uses proposed cost factors shown in the following diagram:

Performance curves of current and proposed cost factor scenarios are shown in the following diagram:

Penalty detection and sentiment
Findings
• Data scientists must build an intelligent solution by using multiple machine learning models for penalty event detection.
• Data scientists must build notebooks in a local environment using automatic feature engineering and model building in machine learning pipelines.
• Notebooks must be deployed to retrain by using Spark instances with dynamic worker allocation
• Notebooks must execute with the same code on new Spark instances to recode only the source of the data.
• Global penalty detection models must be trained by using dynamic runtime graph computation during training.
• Local penalty detection models must be written by using BrainScript.
• Experiments for local crowd sentiment models must combine local penalty detection data.
• Crowd sentiment models must identify known sounds such as cheers and known catch phrases. Individual crowd sentiment models will detect similar sounds.
• All shared features for local models are continuous variables.
• Shared features must use double precision. Subsequent layers must have aggregate running mean and standard deviation metrics Available.
segments
During the initial weeks in production, the following was observed:
• Ad response rates declined.
• Drops were not consistent across ad styles.
• The distribution of features across training and production data are not consistent.
Analysis shows that of the 100 numeric features on user location and behavior, the 47 features that come from location sources are being used as raw features. A suggested experiment to remedy the bias and variance issue is to engineer 10 linearly uncorrected features.
Penalty detection and sentiment
• Initial data discovery shows a wide range of densities of target states in training data used for crowd sentiment models.
• All penalty detection models show inference phases using a Stochastic Gradient Descent (SGD) are running too stow.
• Audio samples show that the length of a catch phrase varies between 25%-47%, depending on region.
• The performance of the global penalty detection models show lower variance but higher bias when comparing training and validation sets. Before implementing any feature changes, you must confirm the bias and variance using all training and validation cases.
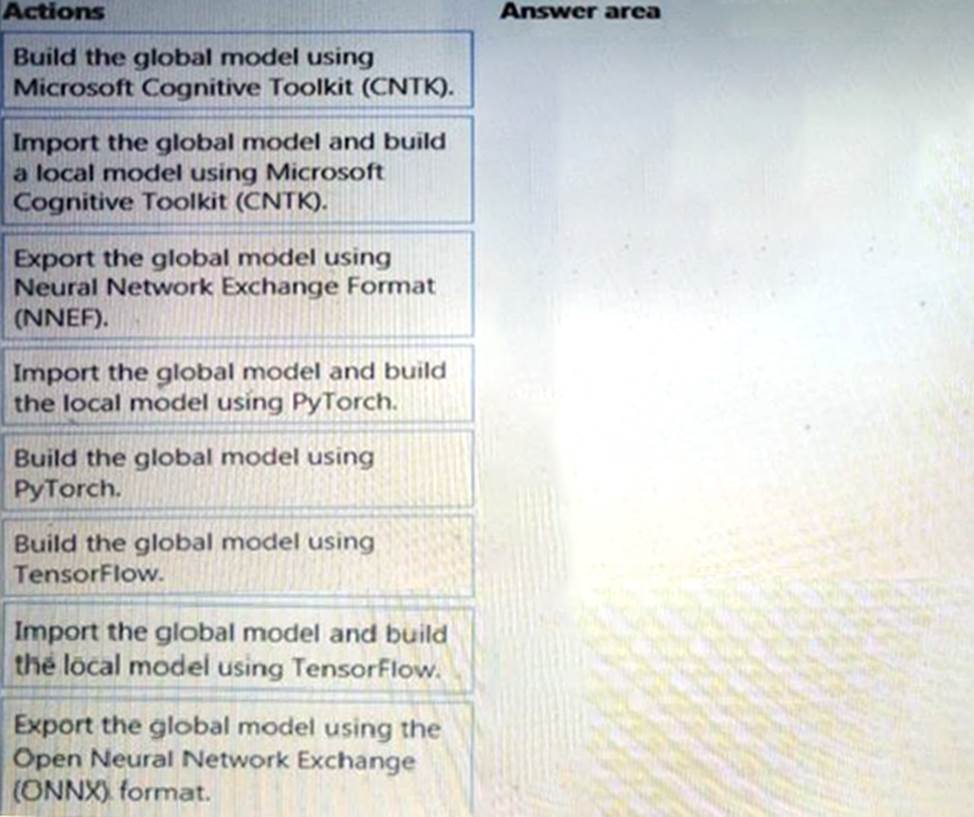
DRAG DROP
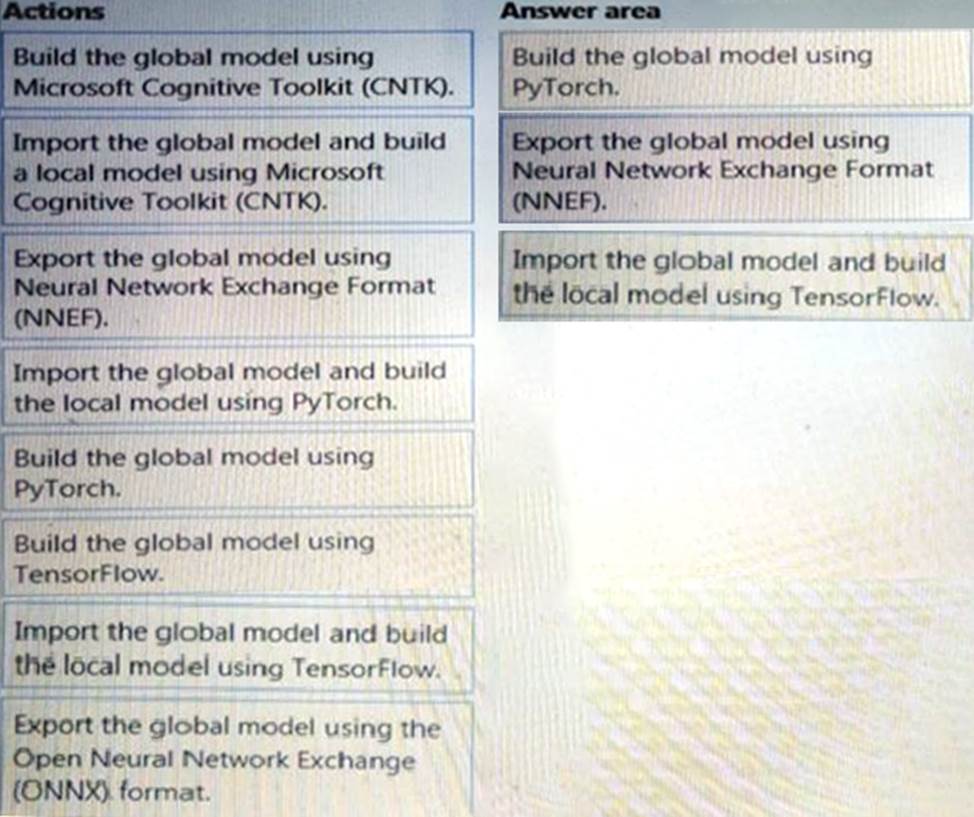
You need to define a process for penalty event detection.
Which three actions should you perform in sequence? To answer, move the appropriate actions from the list of actions to the answer area and arrange them in the correct order.

Answer: 
Latest DP-100 Dumps Valid Version with 227 Q&As
Latest And Valid Q&A | Instant Download | Once Fail, Full Refund

